
More Information
Submitted: July 30, 2022 | Approved: August 24, 2022 | Published: August 25, 2022
How to cite this article: Lino LO, Confolent C, Signoret V, Génard M, Quilot-Turion B. Genetic variability in the susceptibility of immature peach fruit to Monilinia laxa is associated with surface conductance but not stomatal density. J Plant Sci Phytopathol. 2022; 6: 091-100.
DOI: 10.29328/journal.jpsp.1001081
Copyright License: © 2022 Lino LO, et al. This is an open access article distributed under the Creative Commons Attribution License, which permits unrestricted use, distribution, and reproduction in any medium, provided the original work is properly cited.
Keywords: Prunus persica; Brown rot; Fungal disease resistance; Stomata number

Genetic variability in the susceptibility of immature peach fruit to Monilinia laxa is associated with surface conductance but not stomatal density
Leandro Oliveira Lino1,2, Carole Confolent3, Véronique Signoret1, Michel Génard2 and Bénédicte Quilot-Turion1*
1INRAE, GAFL, F-84143, Montfavet, France
2INRAE, PSH, F-84914, Avignon, France
3*UMR 1095, INRAE/Université Blaise Pascal, GDEC, F-63100, Clermont-Ferrand, France
*Address for Correspondence: Bénédicte Quilot-Turion, INRAE, GAFL, F-84143, Montfavet, France, Email: [email protected]
Monilinia laxa is a fungus that causes brown rot in stone fruit. Immature green fruits in the first stage of fruit development (stage I) are generally susceptible. To investigate the relationship between the physical characteristics of immature fruit and susceptibility to M. laxa, we characterized the progeny, derived from a clone of wild peach (Prunus davidiana) crossed with two commercial nectarines (Prunus persica) varieties, through laboratory infection, transpiration monitoring and stomata counting. Two types of fruit infections were observed - ‘classic’ brown rot and ‘clear spot’ symptoms - which have not previously been described in the literature. The number and density of stomata did not explain the observed variability of infection in the progeny. However, surface conductance was positively correlated with infection level. This study provides experimental evidence partially linking physical fruit characteristics to brown rot infection at the immature fruit stage. The role of delayed cuticle deposition in susceptibility to brown rot of immature fruit is discussed.
The flesh of fruits is protected by the epidermis, which is covered with a cuticle. This cuticular membrane is a hydrophobic layer of cutins and waxes that provides protection from abiotic stresses and serves as a defensive barrier to plant pathogen attacks [1,2].
Monilinia species cause brown rot in stone fruits such as peaches, thus resulting in dramatic losses in fruit production. Monilinia spp. has often been considered opportunistic fungi because they enter the fruit mainly through injuries, either visible (insect or bird bites or injuries due to wind) or microscopic (see [3] for review). Pascal, et al. [4] have demonstrated the major role of the integrity of the epidermis in protecting fruit against M. laxa. More recently, Borve, et al. [5] have demonstrated a clear link between cracking and brown rot in cherries, finding significant correlations between cultivar-specific numbers of micro-cracks and the resulting incidence of brown rot. In addition, Nguyen-The, et al. [6] have observed that the mycelium of M. laxa develops through cuticular cracks, which are considered the preferred microscopic entrance channels for the fungus [7]. However, cuticular cracks often appear late in fruit development and cannot explain the sensitivity of peach fruit in its early stages of development. In addition to microcracks, stomata can also act as entry points for infection. Wade and Cruickshank [8] have shown that M. fructicola can enter the guard cells via the thin wall of the stomata in apricots in a laboratory setting. Fungal invasion then develops through the substomatal cavities. In case of natural infection, the infection can develop on a fruit if a single spore falls into a stomata and germinates. In this case, the number of fruit stomata determines the probability of infection, more than the density of stomata. On the contrary, in the case of a controlled infection by a drop of suspension, the surface of the drop does not vary between fruit. Thus, what determines the probability of infection is the density of stomata, in the surface of the drop, of each fruit infected.
Stomata number is determined very early in fruit organogenesis and remains constant, whereas stomatal density decreases as the fruit surface expands [9,10]. In the early stages, stomata allow gas exchange for photosynthesis [11]. They then lose this feature, close permanently or remain open continuously, or tranSform into lenticels during fruit ontogeny. Stomata and microcracks impair the integrity of the cuticle membrane and its function as a defensive barrier. The integrity and deposition of the cuticle on the fruit surface are usually assessed by cuticular conductance measurements that estimate water vapor diffusion. Such measurements have also been used to evaluate the susceptibility of fruit surfaces to pathogen entry [12]. Although the cuticle is formed early in the development of the fruit [13-15], in the very early stages of fruit development, it is not well established [16] and may not be an efficient barrier to pathogens. Few data are available on fruit infections by M. laxa during the early stages of fruit growth [17] or on the importance of stomata and cuticles in the development of infections. A better understanding of the factors that influence fruit susceptibility would enable more careful control of pathogens and would decrease costs and environmental risks.
In this context, we focused on a poorly understood early stage of fruit growth (stage I) to determine whether physical fruit characteristics are involved in immature fruit susceptibility to brown rot. We characterized the surface conductance and stomata number of fruits and made infection tests.
Vegetal material
The breeding population was derived from clone P1908 of Prunus davidiana (D) as follows [18]. In the first generation, P1908 was crossed with Prunus persica cv. ‘Summergrand’ (S). An F1 progeny was obtained. In the second generation, one F1 hybrid resistant to powdery mildew was back-crossed to S to produce a BC1 progeny. In the third generation, a mixture of pollen from BC1 genotypes was used to pollinate P. persica cv. ‘Zéphir’ (Z) to derive the breeding population. S and Z are respectively yellow and white nectarine cultivars with large, tasty fruit. For brevity and clarity, this population will be referred to as BC2 throughout this manuscript, although the P. persica parents (P) used to produce the BC1 and BC2 progeny are not identical.
Despite this population segregates for peach versus nectarine and that stomata can be observed for nectarines only, this population was chosen for this study because i) it showed a very great variability for all the characters studied before (compared to intra-specific crosses), ii) prior scoring showed large variations of surface conductance among the individuals and interesting variability for brown rot resistance that resulted in detection of QTL (data not shown).
The study was conducted at the INRAE Research Centre of Avignon (southern France) on 142 BC2 genotypes. BC2 genotypes and the three parents were planted in 2001 in an orchard with one tree per genotype. The trees were 17 years old in 2015. All genotypes were grafted onto GF305 seedling rootstocks and were grown under normal irrigation, fertilization and pest-control conditions. All trees were homogeneously pruned and thinned.
Fruit sampling
Fruits were harvested in the spring of 2015 during the first stage of development (small green fruit from 1 to 20g). Two sets of samples were harvested for each genotype on 2 different dates. Flowering began on February 10th and ended up on March 6th. The early flowering and maturing genotypes were harvested first. The first series of measurements took place from 23rd to 30th April, ie 52 to 73 days after flowering. The same genotypes (if enough fruit were present) were harvested a second time (2nd series: 4th to 12th May) 12 days after the 1st harvest in the same order to assess response differences depending on the status of fruit development.
For each genotype and for each of the two harvests, 20 fruits were harvested for infection tests, 10 fruits for transpiration measurements and 3 fruits per genotype (only nectarines) to estimate the number of stomata. At each harvest date, all fruit was weighed and the 3 diameters (fruit height, between-cheeks diameter and the distance from the suture to the opposite side) were measured using a caliper. The fruit was considered ellipsoidal and its surface area was estimated using the following formula:
With p = 1.6075 and a, b and c representing the three radii.
Monilinia laxa
The strain of Monilinia laxa used for infections was Ml3. It was isolated from an apricot fruit mummy on March 25th, 2011 and cultured in the laboratory at INRA Gotheron (Drôme). A mono-spore strain was isolated and stored at -20 °C.
This fungus was bred on a V8 agar medium at 21 °C ± 2 °C (16-hour day and 8-hour night) and kept in a glycerol solution in aliquots of 45 μL stored at -20 °C. The culture was multiplied by transplanting aliquots on Petri dishes containing V8 agar with a medium based on vegetable juice two weeks before an experiment that required a spore suspension. Petri dishes covered with Parafilm were incubated at 21 °C ± 2 °C with 16 hours of light.
Infection tests
A spore suspension of M. laxa was prepared before each infection test from a 15-day-old culture dish. Five milliliters of sterile distilled water were added to the culture medium, and the agar surface was scraped with a sterile spatula to remove the spores and the mycelium. The resulting mixture was tranSferred into a vial containing small glass beads to which a drop of Tween was added. The vial was vortexed for approximately 30 seconds to separate the spores from the mycelium. Thereafter, the entire suspension was sampled using a syringe and passed through a 30-micron filter to obtain a suspension with minimal hyphae and maximal spores. To estimate the spore concentration of the suspension, the number of spores in a 1/10th dilution of the mother solution was counted on a Malassez cell under a microscope.
Spore viability was verified for each suspension. Five separate drops of 5 μL of the final suspension were deposited on a transparent PDA culture medium to facilitate microscopic observation. Seeded Petri dishes were closed and placed at room temperature. After 24 h, the germination rate was calculated for each drop by microscopic counting of germinated and non-germinated spores. A spore was considered germinated when it had a germ tube larger than the spore.
For each genotype, 20 fruits were numbered and placed in a clear plastic box without any previous treatment. Each fruit was tested with a drop of 10 μL of spore suspension (concentration of 100 spores/µL) deposited without wounding the fruit on the intact fruit surface in the equatorial zone of a cheek (in the area where stomata are counted—see below). To maintain sufficient humidity in the boxes, water cups were added to support the development of the fungus. Observations were made daily for five days to record fruit infection or not (Inf) and to measure the diameters of the lesions (LesionDiam) if any. From this, the infection probability (ratio between the number of fruits infected 5 days after the deposition of the drop and the total number of fruits tested (i.e. 20)). A total of 138 and 110 genotypes were monitored for infection tests; 106 genotypes were common to both series. To consider the probable phenological shift among genotypes, the maximum infection probability between the 2 harvests for each genotype was computed and used in further data analyses. From this data selection, the mean speed of progression of the lesion (LesionSpeed in mm/hour) and the time elapsed between the deposition of the drop and the first observation of an infection spot (LesionDelay, hour) were calculated for each genotype.
Fruit surface conductance assessment
To calculate the permeation coefficient of water vapor through the fruit surface (surface conductance), ρ, monitoring of fruit mass loss was performed.
For each genotype, 10 freshly harvested fruits were numbered. The fruit pedicel was covered with varnish to prevent water loss from this zone. Fruits were then placed in a ventilated chamber. Temperature and relative humidity were continuously measured (Datalogger LOG 1520, SEFRAM®, St Etienne, France). Each fruit was weighed every 90 minutes for approximately 7 h.
The hourly surface conductance (g(h), cm h−1) of each fruit was computed following the method described by Gibert, et al. [19] as follows:
where h is the time after sampling (h); Tf is the transpiration per unit time (𝑔 ℎ−1), which is equal to the weight loss; Sf is the fruit surface area at h = 0 (𝑐𝑚2); Mw is the molecular mass of water (18 𝑔 𝑚𝑜𝑙−1); R is the gas constant (83 𝑐𝑚3 𝑏𝑎𝑟 𝑚𝑜𝑙−1𝐾−1); Temp is the temperature (𝐾); P∗ is the saturation vapor pressure (𝑏𝑎𝑟) [depending on temperature following the equation of Fishman and Génard [20]: P* = 0.008048* 𝑒𝑥p(0.0547* (𝑇𝑒𝑚𝑝 – 273.15)]; Hf is the relative humidity within the fruit (assumed to be 100%); and Ha is the relative humidity of the atmosphere.
During measurement, the hourly surface conductance per fruit was either relatively constant or decreased, owing to slight drying out of the fruit. To compute the finest unique value of hourly surface conductance for a given fruit, the relationship between g(h) and the relative water loss (RWLh) was calculated. RWLh was defined as follows:
Where M0 is the initial fruit fresh mass and Mh is the fruit fresh mass at time h. When the linear relationship was significant (p < 0.05), fruit surface conductance was taken as equal to the y-axis intercept of the linear relationship (RWLh = 0), corresponding to the maximal value observed, and was otherwise set to be equal to the mean of the hourly conductance over the observations [19].
A total of 149 and 129 genotypes were monitored for fruit mass loss from the two harvest series, respectively; 127 genotypes were common to both series. Fruit total surface conductance was computed for each fruit by multiplying the hourly surface conductance by the surface of the corresponding fruit.
Stomata number estimation
A preliminary experiment was performed to design a protocol suitable to estimate the mean number of stomata per fruit for a large number of nectarine genotypes on the basis of immature fruits. The results obtained are presented in Supplementary data File S1.
Measurements of the number of stomata for each genotype were conducted once during the 2nd series of harvests on 121 genotypes (nectarines only). The imprint of the fruit surface was made on the equator ring from suture to suture with a hardener varnish (ECRINAL ASEPTA laboratories). After hardening the varnish, the imprint was removed with adhesive tape and deposited on a slide. With a microscope equipped with a camera, five pictures were taken along each imprint (ie 5 pictures per fruit). The number of stomata present on each photo was counted manually using ImageJ (win64). A total of 1815 photos taken on 363 fruits were analyzed. For each genotype, the average number of stomata n was calculated from 3 fruits:
The average number of stomata n calculated in this way for each genotype was considered a constant during fruit development. In contrast, the stomatal density decreased during fruit growth. For any fruit of a given genotype harvested at any time during fruit growth, the stomatal density was estimated by dividing the number of stomata n of the genotype by the surface area of the fruit considered.
Statistical analysis
Graphical representations and statistical analyses were performed using R (version 4.0.5) [21]. The 'loess' function, allowing adjustment by local polynomial regression, was used to add trends showing the relationships between two variables on graphs. To explore the effects of different factors on the variables of interest, the ‘aov’ function was used to perform an analysis of variance (ANOVA). The proportion of variance of the variable of interest explained by a factor was estimated by dividing the sum of squares for the factor by the sum of squares total.
Physical characteristics of immature fruit in the population
Immature fruits from one hundred genotypes were studied to characterize two physical characteristics potentially linked to susceptibility to M. laxa infection: stomata density and surface conductance.
The density of stomata of a fruit is the relevant variable related to infection susceptibility. This factor can be decomposed into two components: the total number of stomata of the fruit and the surface area of the fruit. The latter constantly changes during fruit development, whereas the former can be considered a genetic constant with respect to variation among genotypes.
For each genotype, the stomata number was estimated from 3 fruits on the basis of 5 pictures taken along the imprint of the fruit surface made on the equator ring from suture to suture. Stomata number has a near-normal distribution in the population with a right tail towards large values. This factor was highly variable among genotypes, ranging from 43,459 to 132,050 (Figure 1). Between-genotype variance represented 76% of the total variance and the associated p - value (Fisher test) was highly significant (< 2 10-16). Therefore, between-fruit (within genotype) variation was small compared with the genotype effect and the fruit stomata number appeared stable among fruits of the same genotype and highly variable among genotypes.
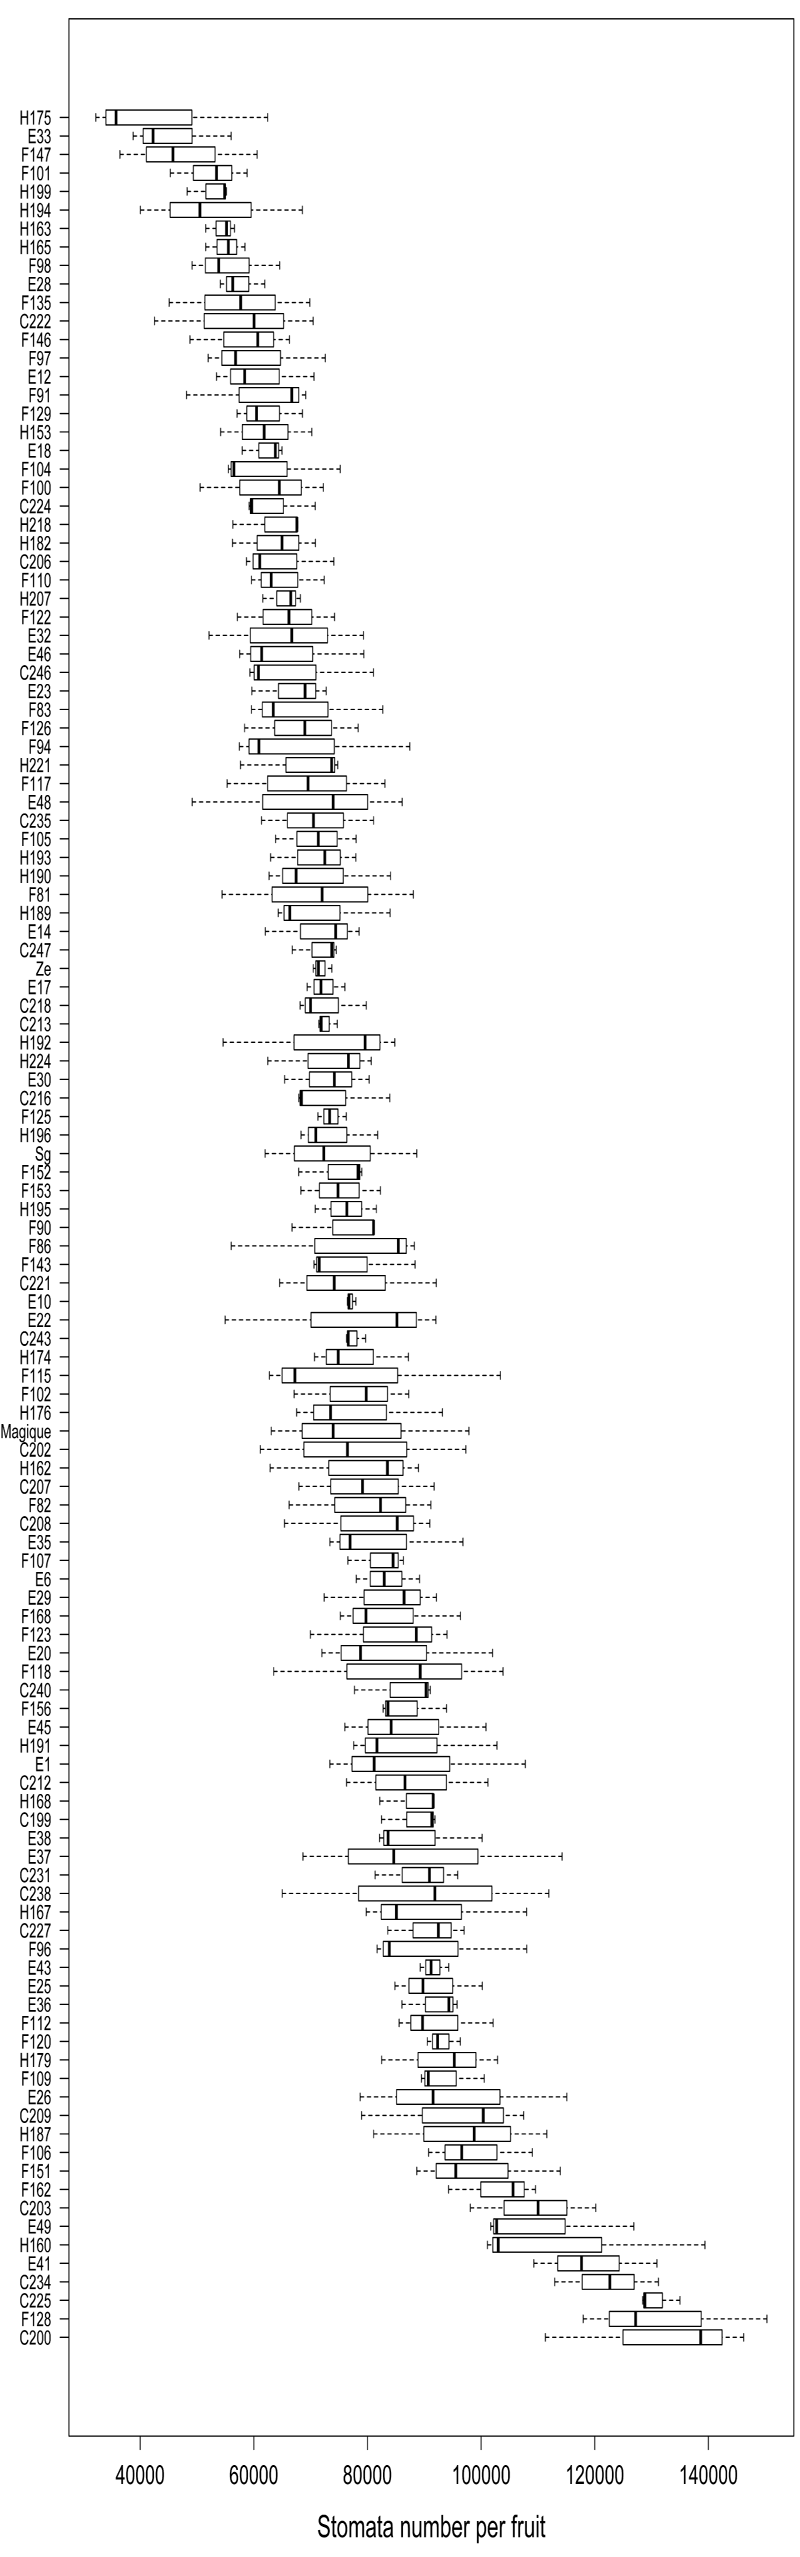
Figure 1: Distribution of stomata number for 121 nectarine genotypes of the BC2 population, ordered by increasing mean number. Within-genotype variability is from measurements of 3 fruits.
Considering the small within-genotype variability of stomata number, we further considered the number of stomata per genotype as a genotypic constant and kept the mean value of stomata number estimated for each genotype as specific to the genotype. Then, this genotypic stomata number was used to estimate the stomatal density of every fruit harvested, by dividing the genotypic stomata number by the surface area of the fruit considered. This extrapolation was further used to explore links among variables.
Fruit surface conductance was the second variable characterized in immature fruit in the population by monitoring transpiratory losses. Surface conductance was assessed on two dates during stage I. The general trend of fruit surface conductance data plotted against fruit mass follows a decreasing curve (Figure 2). The smallest fruit displayed the highest values of surface conductance, falling sharply and then remaining stable as fruits grew. Although the fruit growth progressions were similar, a notable difference in levels was observed between peach and nectarine fruits, with the former displaying higher values of surface conductance.
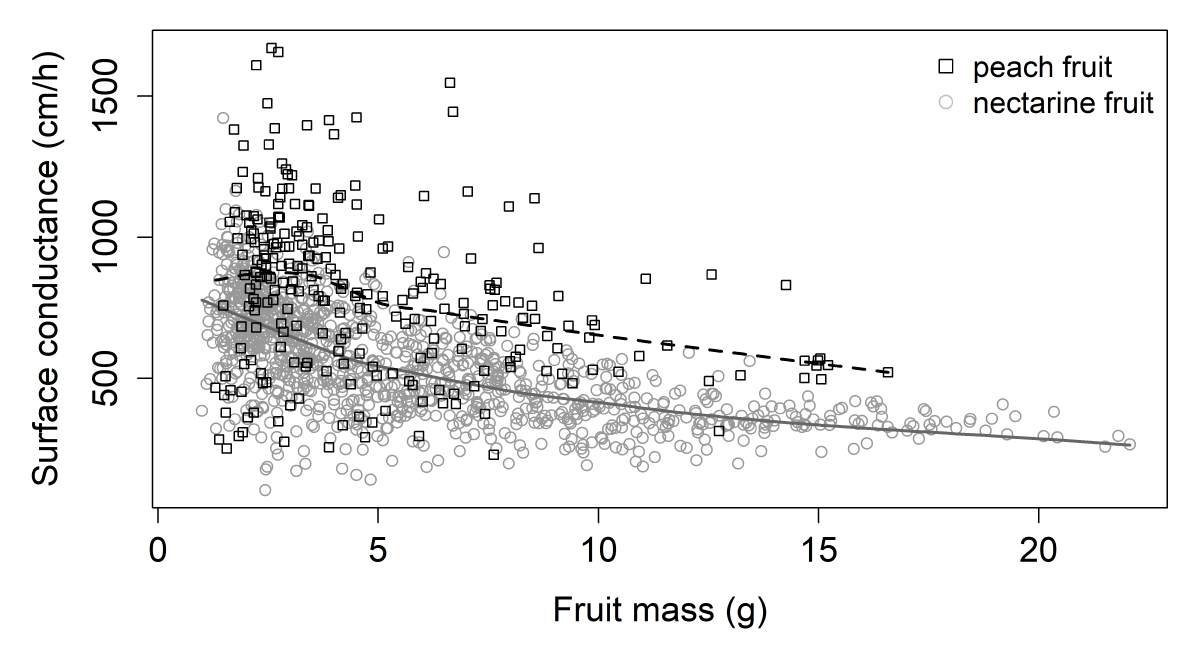
Figure 2: Surface conductance (cm/h) according to fruit mass (g) for both harvest series at stage I. Each point represents a fruit. The black and gray lines were obtained by local polynomial regression fitting (control settings were 0.75 for span and 1 for degree) peach and nectarine data, respectively (equivalent number of parameters: 3.38 and 3.25 and residual standard errors: 272.3 and 142.3 for the two smoothings respectively).
To decipher the role of stomata in surface conductance at stage I, we explored the relationship between surface conductance (cm/h) and fruit stomatal density (Figure 3). A positive relationship was observed between the mean genotype values of these two traits, with a high effect of fruit stomatal density on surface conductance (p - value < 2e-16). Indeed, stomatal density explained 51.6% of the variation in observed surface conductance.
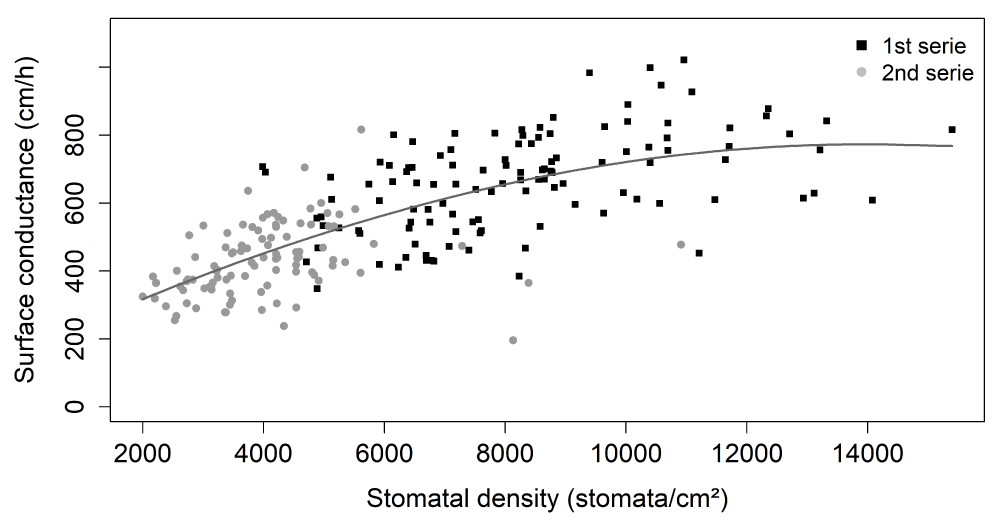
Figure 3: Relationships between surface conductance (cm/h) and fruit stomatal density (stomata/cm²). The black and gray symbols are mean genotype values at the 1st and 2nd series, respectively. The gray line was obtained by local polynomial regression fitting (control settings were 2 for span and 2 for degree) in both series together (equivalent number of parameters: 3.06 and residual standard errors: 116.1).
To predict the conductance of any fruit from the other experiments (fruit used to count stomata number and for infection tests) from its mass and genotype, we smoothed the relationship between mass and surface conductance for each genotype (Supplementary Figure S1). Then, for every fruit harvested for a given genotype at any stage, we interpolated its surface conductance from the corresponding fruit mass. This interpolation was then used to further explore links among fruit surface conductance, stomata density and fungal susceptibility.
Infection probability and different response symptoms
We observed fruits with "classic" infections, displaying the development of brown rot covering the entire fruit, as well as fruits with a ‘clear spot’ symptom that reached a limited size of approximately 5 mm in diameter and then stopped growing (Figure 4). Observations with a binocular microscope with a solution of toluidine blue at 0.1% showed hyphae and signs of infection in the middle of the spots (Figure 5). This symptom has never been described before in the literature, although in our experiment, it was found in most responses to infections.
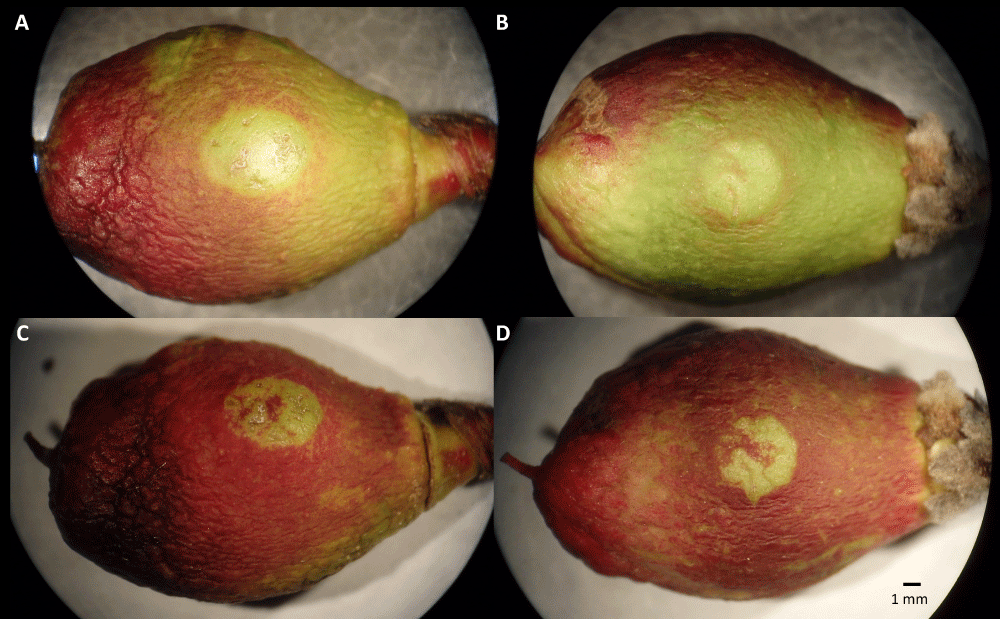
Figure 4: Images of ‘clear spot’ phenotype on immature fruit at stage I of two genotypes 13 days (A, B) and 23 days (C, D) after drop deposition in the center of the visible cheek. The fruit is approximately 20 mm long.
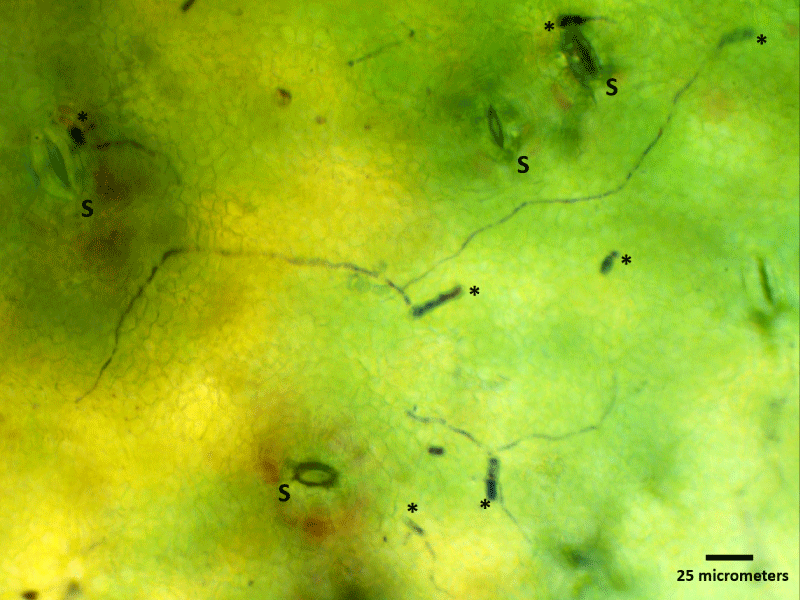
Figure 5: Light microscopy image of spore germination on a ‘clear spot’ symptom area of immature nectarine surface colored with Toluidine blue, 0.1%. This image illustrates the germination of spores (asterisks) around stomata (S) and the colonization of the surface by hyphae.
Because of a lack of fruit on some trees, more genotypes were tested in the first harvest (138) than in the second (110), but 4 were tested only in the second harvest. For the 1st harvest, 50% of genotypes (69 of 138) were susceptible, and 88% of them displayed ‘clear spot’ symptoms (61 of 69). For the 2nd harvest, just 23% of the genotypes (25 of 110) developed symptoms, and 60% of them (15 of 25) displayed ‘clear spot’ symptoms (Figure 6, right panel). Thus, ‘clear spot’ symptoms were more frequent in the 1st harvest. Finally, 57 BC2 genotypes were resistant in both harvests at stage I (Figure 6A). Among the susceptible genotypes, the infection probability was generally low, especially for fruits displaying classic symptoms (Figure 6B). For the genotypes presenting ‘clear spot’ symptoms (Figure 6C), the range of infection probabilities varied from 0.1 to 1. The fruit type, peach versus nectarine, had no significant effect on the susceptibility nor on the infection probability.
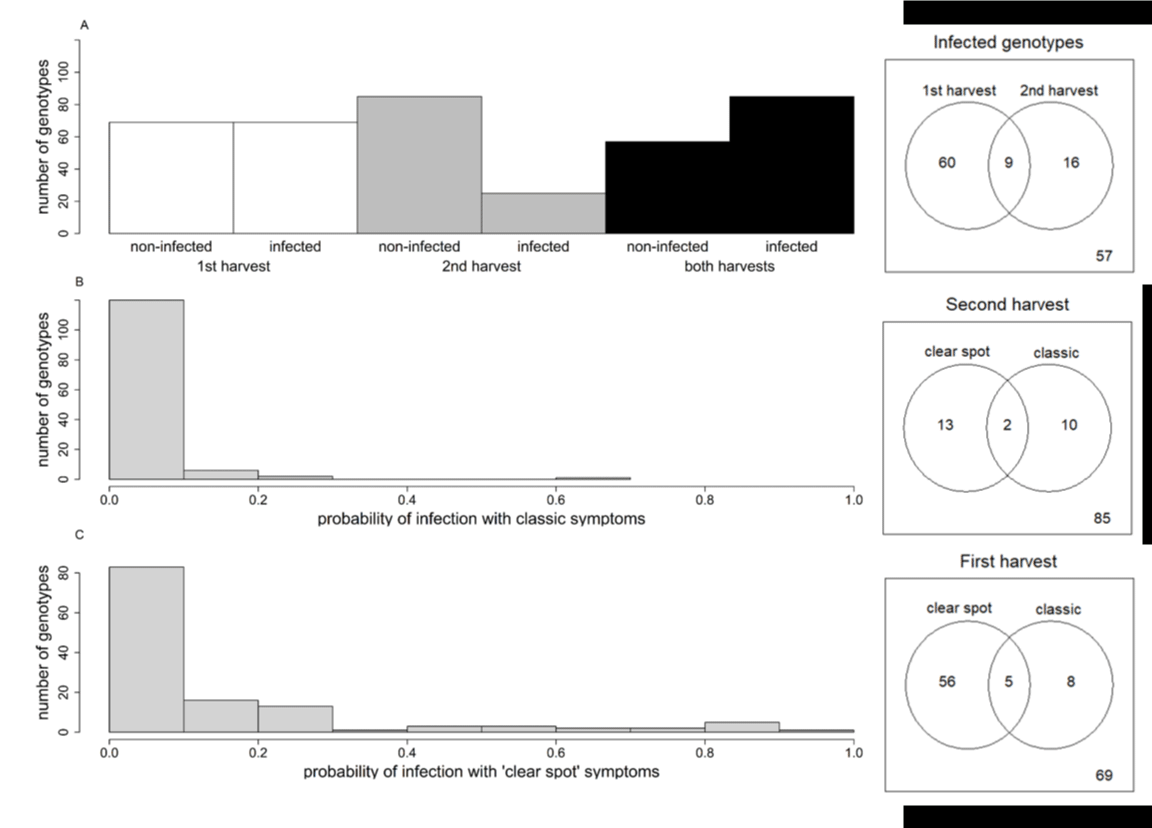
Figure 6: Left panel: Number of genotypes with no infected fruit (non-infected) or infected fruit at both harvests during stage I (A). Distribution in the BC2 progeny of maximal probability of infection between the 2 harvests with classic symptoms (B) and ‘clear spot’ symptoms (C). Right panel: Number of infected genotypes at each harvest and both harvests. A number of genotypes with ‘clear spot’ and/or classic symptoms at the first and second harvests. The number at the bottom right corresponds to non-infected genotypes.
The evolution of the diameter of the lesion caused by the fungus was monitored (Figure 7). The resulting profiles displayed different kinetics according to the type of symptoms. Lesions on fruits displaying classic symptoms (Figure 7A and B) progressed toward large diameters, whereas those displaying ‘clear spot’ symptoms ceased growing (Figure 7C and D). In addition, the mean speed of progression of the spot was lower for ‘clear spot’ symptoms than for classic symptoms (Figure 8). For classic lesions, a large inter-genotype variability was observed, and certain genotypes showed a greater predisposition toward the rapid development of the fungus after infection.
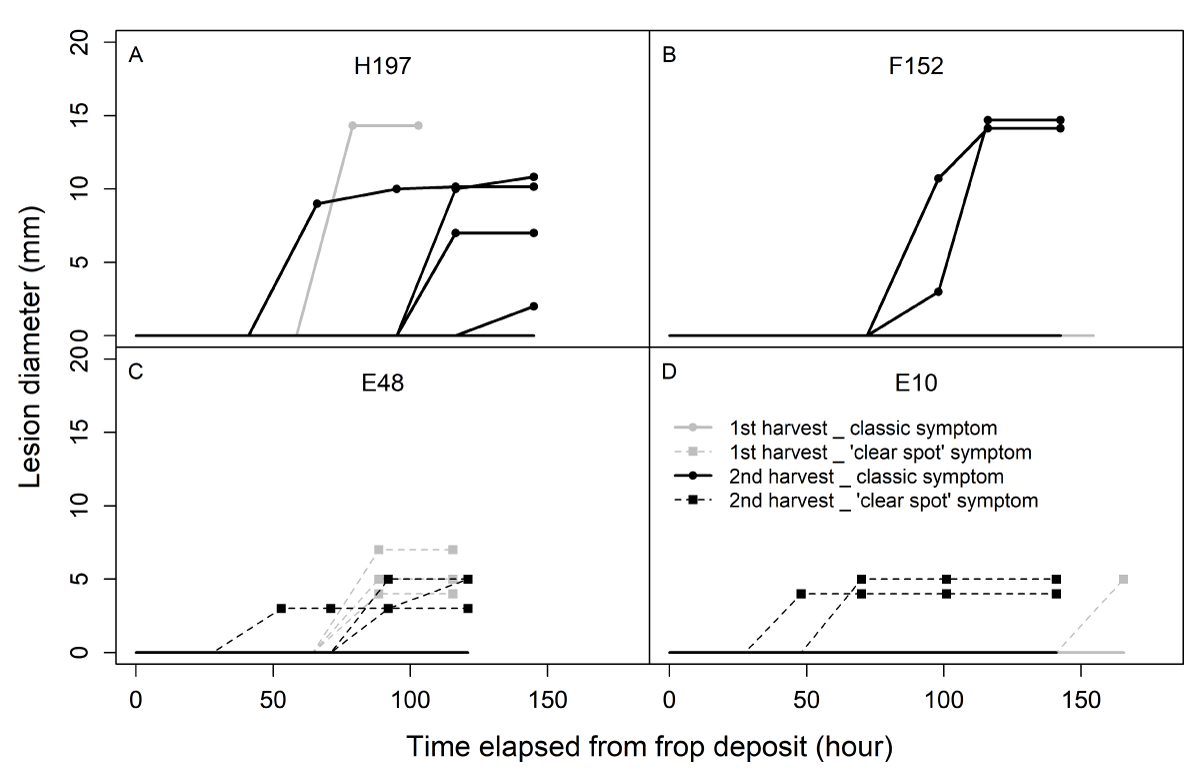
Figure 7: Evolution of the diameter of the lesions of fruits from 4 genotypes displaying classic (A and B; continuous lines) or ‘clear spot’ (C and D; dotted lines) symptoms in both harvests (gray: first harvest; black: second harvest) during stage I. Each evolution curve corresponds to a unique fruit. Twenty fruits per genotype were monitored.
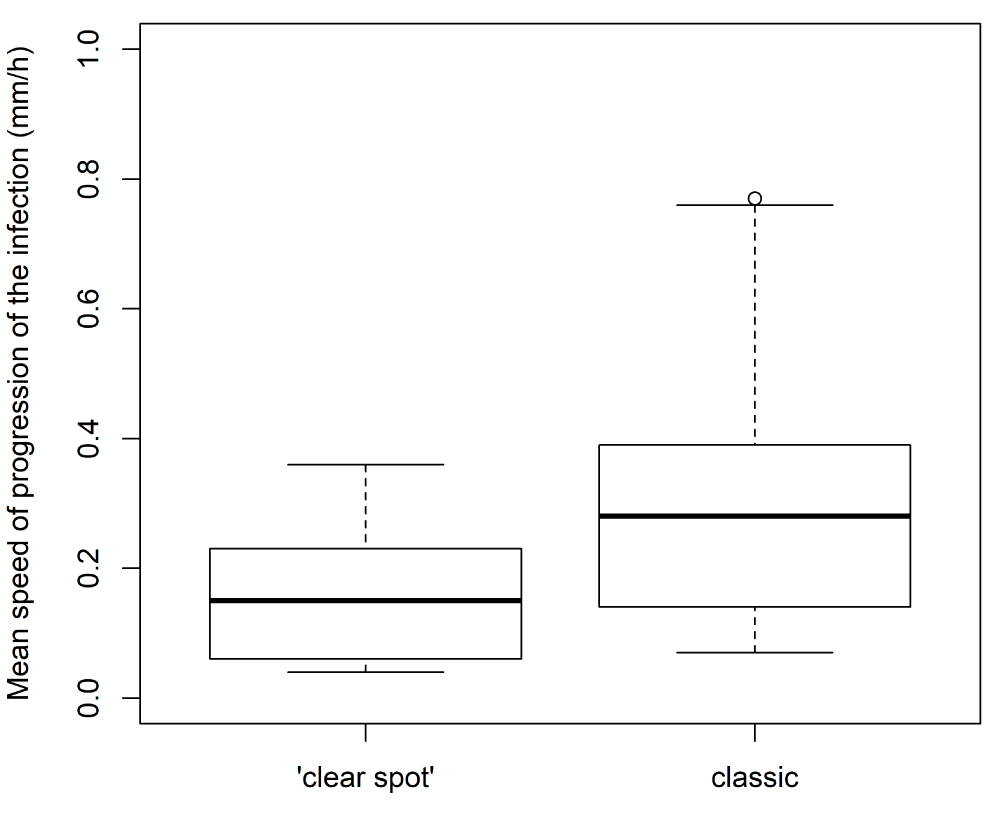
Figure 8: Variability among genotypes of the mean speed of progression of the lesion according to the type of symptoms (‘clear spot’ or classic).
The high variability in the phenology in the progeny (flowering date, time, and growth rate) may have resulted in the shifting of the two harvest dates to either side of the peak of sensitivity expected at stage I. To consider this probable phenological shift among genotypes, the maximum infection probability between the 2 harvests for each genotype was considered further.
Links between physical fruit characteristics and fungal susceptibility
The effects of fruit mass, surface conductance, and density of stomata on the sensitivity of fruit to M. laxa at stage I of growth were investigated (Figure 9). Two variables linked to infection were explored, one binary and the other quantitative: susceptibility (versus resistance) and probability of infection. Among the fruit characteristics, only surface conductance (cm/h) was significantly related to fungal susceptibility (Table 1). Higher conductance levels were associated with susceptible genotypes. Surface conductance explained 11.9% of the variation of ‘genotype susceptibility versus resistance.’ Although stomatal density was slightly linked to surface conductance, no significant effect of stomatal density on fungal susceptibility was observed. None of the three fruit characteristics had any effect on infection probability.
| Table 1: Summary of statistical results (p - value, significance, and percentage of variance explained) from ANOVA analysis on genotype dataset with unique data per genotype corresponding to the harvest with maximal infection. | |||
| Variables of interest | |||
| Explanatory variables | Genotype susceptibility versus resistance | Probability of infection | |
| Mean fruit mass | p - value Variance explained | 0.0302 ns 5.1% | 0.0821 ns 3.4% |
| Surface conductance (cm/h) § | p - value Variance explained | 0.00163* 11.9% | 0.0522 ns 4.3% |
| Stomatal density §$ | p - value Variance explained | 0.5506 ns 0.37% | 0.0791 ns 3.5% |
| Signif. Codes : ‘***’ 0.0001 ‘**’ 0.001 ‘*’ 0.01 ‘ ns § Surface conductance and stomatal density were interpolated for fruit specifically studied in the infection test and then averaged per each genotype $ only nectarines | |||
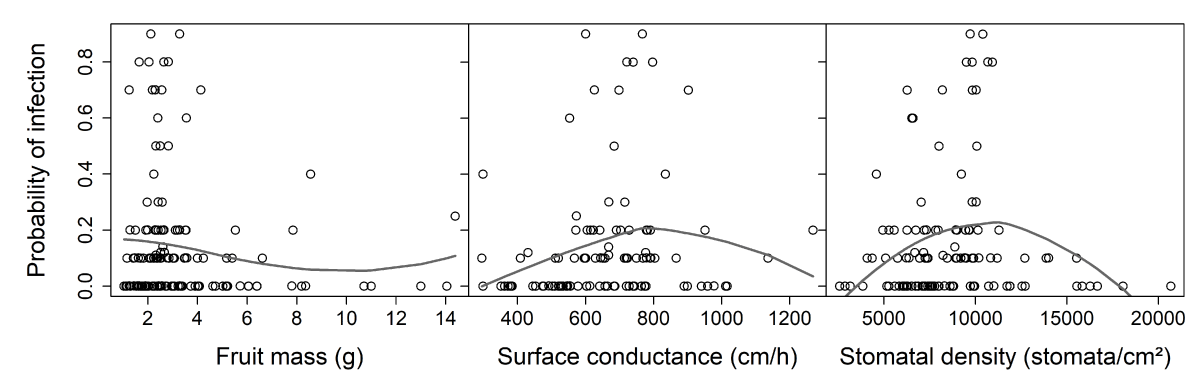
Figure 9: Relationships between 2 variables of infection and tentative explanatory variables, i.e., fruit mass, surface conductance, and stomatal density (nectarines only). Surface conductance and stomatal density were interpolated for fruit specifically studied in the infection test and then averaged by genotype (see ‘Results’ section). A. Genotype susceptibility versus resistance (respectively 1 for genotypes with at least one fruit infected (both classical and ‘clear spot’ symptoms are considered) or 0 for resistant genotypes, with a small amount of variation added with the ‘jitter’ function in R to make all points visible). B. Probability of infection (a quantitative trait from 0 to 1) for genotypes showing ‘clear spot’ symptoms only. The gray lines are tendencies plotted with a local polynomial regression fitting (control settings were 1 for span and 2 for degree)(equivalent number of parameters: 3.28, 3.45, and 3.34 and residual standard errors: 0.221, 0.220, and 0.228 for the three smoothings respectively).
Counting stomata number in a population
The number of stomata is determined during ontogenesis and remains constant during fruit development [10]. With the expansion of the fruit, the stomata are diluted on the surface of the fruit, thus leading to a decrease in density [14,22]. The stomatal density of the peduncle zone decreases throughout fruit growth from 65 stomata/mm² to 5 stomata/mm² [23]. This change results in a decrease in counting accuracy during fruit growth. Very few studies have reported estimates of stomata number in fruits (but see avocado: [24]; lychee: [25]; banana: [26]; plum: [27]; cherry: [28]; peach: [23]). Hence, phenotyping the fruit stomata number of an entire mapping population is an important contribution of the present work. Besides phenotyping being time-consuming, sampling is probably the most critical point. Indeed, stomatal density varies from the pistil to the peduncle zone [12,23,28]. This variability encourages the counting of all stomata from each fruit or the development of a statistical model for the evolution of stomatal density as a function of the position from the peduncle to the pistil. Counting all stomata is conceivable only for low numbers of genotypes or if the count can be automated. Unfortunately, in the case of nectarines, the stomatal density of small fruit is high, and the cuticle relief is very rugged, thus making counting and automation difficult. The second solution (development of a statistical model), applied to a population, would require the model to be the same regardless of the genotype. However, preliminary experiments to determine a protocol showed different profiles of stomatal distribution on the fruit for 2 genotypes of the population. From these experiments, we determined that the middle zone of the fruit (equator ring) should allow a reasonable approximation of the total number of fruit stomata.
Therefore, we chose to sample the imprint of the fruit surface only in the equator zone. This choice contributed to obtaining low intra-genotype variability compared with inter-genotype variability. Calculated numbers of stomata for the BC2 population varied between 43,459 and 132,050, and the observed densities ranged from 21 to 156 stomata/mm² for stage I. For the Zéphir cultivar, 71,846 (± 1246) stomata were counted on average for 3 sampled fruit. The average value obtained for the same cultivar by Gibert, et al. [12] with a different sampling methodology was 70,592 (± 5048). These remarkably similar results support the choice of the methodology used in our experiments.
Exploring the link between stomata and conductance
High surface conductance was observed for very small fruit. Then, surface conductance dramatically decreased for a small mass increase. In the 2nd harvest series, mass was more dispersed, but surface conductance was more stable. The high surface conductance for very small fruits can be explained either by the high density of stomata or by the thin cuticle thickness. Indeed, the surface conductance of the fruit can be decomposed into three components: cuticular, stomatal, and crack conductance [29]. Crack conductance is considered negligible at stage I of fruit development. The significant relationship found in this work between surface conductance (cm/h) and stomatal density explained as much as 51.6% of the variation of surface conductance. Such a trend has been observed in cherry fruits at later stages of fruit development [14].
Resistant fruit, ‘classic’ infection and ‘clear spot’ symp-toms: A very mixed population
The BC2 population showed high variability in susceptibility to M. laxa, with probabilities of infection ranging from 0 to 100%. Biggs and Northover [30] and Mari, et al. [17] have shown that peach fruit is very sensitive to M. spp. in stage I. On the basis of these results, we expected to observe a high probability of infection in our progeny. However, 41 BC2 genotypes proved to be resistant at both harvests within stage I. Therefore, either resistance factors segregate in this population or the susceptible stage was very short and was missed in this experiment. Similarly, high probabilities of infection were expected, but for most of the susceptible genotypes, we observed low probabilities of infection. In addition, the observation of ‘clear spot’ symptoms in response to M. laxa was novel. Fruits showing these symptoms were kept for nearly one month in the boxes, and no ‘classic’ brown rot symptoms developed. The infection started as the fungi developed hyphae and then stopped. This fruit reaction prevented the spread of local infection. These elements suggested a hypersensitivity reaction of the fruit, which was probably due to an active biochemical response of the fruit, thereby leading in some cases to the cessation of fungus development.
In addition to the likelihood of infection, the diameter of infection was monitored for 6 days. This monitoring allowed for the calculation of the average speed of infection progression for each infected fruit and the minimum and average times before the appearance of a lesion. The variability in these parameters also suggested that additional mechanisms were involved in fungal propagation after the infection was established.
Hypotheses explaining the variations in the suscepti-bility of immature peaches to M. laxa
Various hypotheses can be advanced to explain the variations in the susceptibility of peaches to M. laxa in the first stage of fruit growth. These hypotheses are either mechanical or biochemical. In stage I, the mechanical barriers may have insufficient efficacy. On the skin of nectarines, Lee and Bostock [31] have observed the formation of appressoria by M. fructicola on the lips of stomatal guard cells, thus suggesting that stomata can be a gateway into the fruit for the fungus. This function is likely because in stage I, stomatal density is high, and stomata are able to open and close. However, we observed no relationship between the number of stomata of a genotype and susceptibility to M. laxa or between the stomatal density of the fruit and the presence of infection. Furthermore, we calculated the number of stomata present in the area of an inoculum drop (5.6 mm²) that was deposited on a fruit. This number ranged from 118 to 874 stomata per drop, depending on the genotype, and appeared to be high enough in all cases to allow for infection via stomata. Therefore, we propose that stomata number at stage I in the studied progeny was not a limiting factor of infection and thus does not explain the observed genetic variability in susceptibility. Finally, to decipher whether stomata play a role in infection at stage I, genotypes with exceedingly low numbers of stomata would be needed.
With regard to the observed variations in susceptibility, more evidence favors an effect of the very thin cuticle on the susceptibility of peach fruits. At stage, I, cuticle deposition on peach fruits has just started (data not shown), and thus, the cuticular membrane has not yet played its role as a barrier to water transport, thus resulting in the high surface conductance levels observed. In addition, this immature cuticular membrane certainly does not fulfill its role as a defensive barrier against pathogens, thereby explaining the significant relationships observed between surface conductance and infection traits.
Our results, combined with those from the literature, suggest that multiple resistance factors limit infection by M. laxa. As such, the wisest strategy in terms of varietal innovation would be to try to combine these factors to increase levels of resistance in new varieties. We must continue to explore the characteristics of fruits at stage I to uncover the role of the cuticular membrane in infection and to decipher whether it is passive (impermeable barrier) or active (inhibition of the fungus), to gain an understanding of resistance factors. Similarly, further analyses of the mechanisms of the onset of ‘clear spot’ symptoms are needed to better understand immature fruit defense reactions. This information may be crucial to solving the problem of brown rot at fruit maturity.
The main conclusion of this study is that the number of stomata is not a limiting factor of infection in stage I of peaches. In contrast, surface conductance is linked to susceptibility but does not explain all of the observed genotypic variations for infection probability. The cuticle, probably not completely deposited at the studied stage when fruit can be susceptible to infection, may already partially plays its role of physical barrier to limit surface conductance but not completely its role of defense barrier against M. laxa. Other factors that we did not study or detect herein may play critical roles in allowing infection. Indeed, in addition to the cuticle thickness, its composition may be important. Considering these results as well as those from the literature, we suggest that delayed cuticle deposition may have an important role in influencing immature fruit development.
We thank N. Belyekdoumi for her help with experiments and data management. We are grateful to the IE-EMMAH UMR1114 team for maintaining the experimental orchard. This work was funded by the “FruitBreedomics” European Project (Seventh Frame Program; FP7-265582). L.O.L. thanks the CAPES Foundation and the Brazilian Ministry of Education, which provided support through a doctoral fellowship.
Supporting information
Figure S1. Relationships between fruit mass and cuticular conductance for 42 genotypes. In black and blue, data from 1st and 2nd harvests, respectively. Redline is the smoothed line used to extrapolate further conductance value from fruit mass value.
File S1. The preliminary experiment was performed to design a protocol suitable to estimate the mean number of stomata per fruit for a large number of nectarine genotypes on the basis of immature fruits. The results obtained are presented in this file.
Data availability statement
The data that support the findings of this study are available on request from the corresponding author.
- Martin LB, Rose JK. There's more than one way to skin a fruit: formation and functions of fruit cuticles. J Exp Bot. 2014 Aug;65(16):4639-51. doi: 10.1093/jxb/eru301. Epub 2014 Jul 15. PMID: 25028557.
- Serrano M, Coluccia F, Torres M, L'Haridon F, Métraux JP. The cuticle and plant defense to pathogens. Front Plant Sci. 2014 Jun 13;5:274. doi: 10.3389/fpls.2014.00274. PMID: 24982666; PMCID: PMC4056637.
- Oliveira Lino L, Pacheco I, Mercier V, Faoro F, Bassi D, Bornard I, Quilot-Turion B. Brown Rot Strikes Prunus Fruit: An Ancient Fight Almost Always Lost. J Agric Food Chem. 2016 May 25;64(20):4029-47. doi: 10.1021/acs.jafc.6b00104. Epub 2016 May 10. PMID: 27133976.
- Pascal T, Levigneron A, Kervella J, Nguyen-The C. Evaluation of two screening methods for resistance of apricot, plum and peach to Monilinia laxa. Euphytica. 1994;77(1–2):19–23.
- Børve J, Sekse L, Stensvand A. Cuticular Fractures Promote Postharvest Fruit Rot in Sweet Cherries. Plant Dis. 2000 Nov;84(11):1180-1184. doi: 10.1094/PDIS.2000.84.11.1180. PMID: 30832164.
- Nguyen-The C, Hugueney R, Arnoux M. Contribution to the study of the penetration mechanisms of 2 fungal parasites of nectarines: Monilia laxa and Rhizopus stolonifer. Agronomie. 1989; 9:271.
- Byrde RJW, Willetts HL. Brown Rot Fungi of Fruit: Their Biology and Control. Pergamon. Oxford, UK; 1977; 171.
- Wade GC, Cruickshank RH. The Establishment and Structure of Latent Infections with Monilinia fructicola on Apricots. J Phytopathol. 1992; 136:12.
- Blanke MM, Lenz F. Fruit photosynthesis. Plant, Cell Environ. 1989; 12:31-46.
- Pillitteri LJ, Torii KU. Mechanisms of stomatal development. Annu Rev Plant Biol. 2012;63:591-614. doi: 10.1146/annurev-arplant-042811-105451. Epub 2012 Jan 30. PMID: 22404473.
- Roth I. Fruits of Angiosperms . G. Borntra. Berlin: Encyclopedia of Plant Anatomy, Band X Teil 1; 1977. 675.
- Gibert C, Chadœuf J, Vercambre G, Génard M, Lescourret F. Cuticular cracking on nectarine fruit surface: spatial distribution and development in relation to irrigation and thinning. J Am Soc Hortic Sci. 2007; 132(5):583-591.
- Becker T, Knoche M. Deposition, strain, and microcracking of the cuticle in developing ‘Riesling’ grape berries. Vitis. 2012; 51:1-69.
- Knoche M, Peschel S, Hinz M, Bukovac MJ. Studies on water transport through the sweet cherry fruit surface: characterizing conductance of the cuticular membrane using pericarp segments. Planta. 2000 Dec;212(1):127-35. doi: 10.1007/s004250000404. PMID: 11219577.
- Knoche M, Peschel S. Deposition and Strain of the Cuticle of Developing European Plum Fruit. J Am Soc Hortic Sci. 2007; 132(5):597–602.
- Oliveira Lino L, Quilot-Turion B, Dufour C, Corre MN, Lessire R, Génard M, Poëssel JL. Cuticular waxes of nectarines during fruit development in relation to surface conductance and susceptibility to Monilinia laxa. J Exp Bot. 2020 Sep 19;71(18):5521-5537. doi: 10.1093/jxb/eraa284. PMID: 32556164; PMCID: PMC7501825.
- Mari M, Casalini L, Baraldi E, Bertolini P, Pratella GC. Susceptibility of apricot and peach fruit to Monilinia laxa during phenological stages. Postharvest Biol Technol. 2003; 30(1):105–9.
- Pascal T, Kervella J, Pfeiffer F, Sauge MH, Esmenjaud D. Evaluation of the interspecific progeny Prunus persica cv. Summer grand x Prunus davidiana for disease resistance and some agronomic features. Acta Hortic. 1998; 465(1):185-192.
- Gibert C, Lescourret F, Génard M, Vercambre G, Pérez Pastor A. Modelling the effect of fruit growth on surface conductance to water vapour diffusion. Ann Bot. 2005 Mar;95(4):673-83. doi: 10.1093/aob/mci067. Epub 2005 Jan 17. PMID: 15655107; PMCID: PMC4246857.
- Fishman S, Génard M. A biophysical model of fruit growth : simulation of seasonal and diurnal dynamics of mass. Plant, Cell Environ. 1998; 21:739-752.
- Team RC. R: A language and environment for statistical computing. R Foundation for Statistical Computing, Vienna, Austria. ISBN 3-900051-07-0. http://www.R-project.org/. 2012.
- Blanke MM. Photosynthesis of avocado fruit. Proc Second World Avocado Congr. 1992; 179-189.
- Yamaguchi M, Haji T, Yaegaki H. Relationship between fruit cracking and varietal differences of exocarp cell length and stomatal density of nectarine cultivars. Bull Natl Inst Fruit Tree Sci. 2003; 2:77–84.
- Blanke MM, Bower JP. Possible role of stomata in transpiration of avocado fruit. Acta Hortic. 1990; 275:449–50.
- Hieke S, Menzel CM, Lüdders P. Effects of leaf, shoot and fruit development on photosynthesis of lychee trees (Litchi chinensis). Tree Physiol. 2002 Sep;22(13):955-61. doi: 10.1093/treephys/22.13.955. PMID: 12204852.
- Johnson BE, Brun WA. Stomatal density and responsiveness of banana fruit stomates. Plant Physiol. 1966 Jan;41(1):99-101. doi: 10.1104/pp.41.1.99. PMID: 16656239; PMCID: PMC1086303.
- Konarska A. Micromorphological, anatomical and ultrastructural analyses of ovaries and fruitlets indicate early qualitative differences in two Prunus domestica cultivars. Sci Hortic (Amsterdam). 2015; 189:112–21.
- Peschel S, Beyer M, Knoche M. Surface characteristics of sweet cherry fruit: stomata-number, distribution, functionality and surface wetting. Sci Hortic (Amsterdam). 2003;97(3–4):265–78.
- Gibert C, Genard M, Vercambre G, Lescourret F. Quantification and modeling of the stomatal, cuticular and crack components of peach fruit surface conductance. Funct Plant Biol. 2010; 37(3):264.
- Biggs A, Northover J. Early and Late-Season Susceptibility in Peach Fruits to Monilinia fructicola. Plant Dis. 1988; 72:1070-1074.
- Lee MH, Bostock RM. Induction, Regulation, and Role in Pathogenesis of Appressoria in Monilinia fructicola. Phytopathology. 2006 Oct;96(10):1072-80. doi: 10.1094/PHYTO-96-1072. PMID: 18943495.