
More Information
Submitted: July 26, 2021 | Approved: August 05, 2021 | Published: August 06, 2021
How to cite this article: Carmo LST, Ribeiro DG, Barbosa EA, Silva LP, Mehta A. MALDI-MSI method for the detection of large biomolecules in plant leaf tissue. J Plant Sci Phytopathol. 2021; 5: 058-061.
DOI: 10.29328/journal.jpsp.1001061
Copyright License: © 2021 Carmo LST, et al. This is an open access article distributed under the Creative Commons Attribution License, which permits unrestricted use, distribution, and reproduction in any medium, provided the original work is properly cited.
Keywords: Mass spectrometry imaging; Plant-pathogen interaction; Protein biomarkers; Xanthomonas campestris pv. campestris; Arabidopsis thaliana

MALDI-MSI method for the detection of large biomolecules in plant leaf tissue
Lilian ST Carmo1, Daiane G Ribeiro2, Eder A Barbosa3, Luciano P Silva1 and Angela Mehta1*
1Embrapa Recursos Genéticos e Biotecnologia, PqEB Av. W/5 Norte Final CEP 70770-917, Brasília, DF, Brazil
2Universidade Católica de Brasilia, Programa de Pós-Graduação em Ciências Genômicas e Biotecnologia, Universidade Católica de Brasília, Brasília-DF, Brazil
3Instituto de Química - Universidade de Brasília, Campus Universitário Darcy Ribeiro, CEP 70910-900, Brasília, DF, Brazil
*Address for Correspondence: Angela Mehta, Embrapa Recursos Genéticos e Biotecnologia, PqEB Av. W/5 Norte Final CEP 70770-917, Brasília, DF, Brazil, Email: [email protected]
In this study we describe a method for the detection of biomolecules (in the polypeptide m/z range) directly from the surface of plant leaves by using Mass Spectrometry Imaging. The plant-pathogen interaction between Arabidopsis thaliana and the bacterium Xanthomonas campestris pv. campestris was analyzed by comparing infected and non-infected leaf discs submitted to mass spectrometry. The total surface area of ion distribution was calculated for both samples, revealing 23 ions, out of which 3 showed statistical significance. Although these ions were not identified, the results showed that this approach can be successfully applied for the detection of potential polypeptide biomarkers directly on leaf tissue, which is a major challenge in MALDI-Imaging studies.
Advances in mass spectrometry analyses and the develop-ment of new software have made important contributions to the scientific development. In the last two decades, this technology has been applied to map and measure ions from biomolecules, such as proteins, lipids and other biological compounds, directly on the surface of tissue samples [1-4]. Matrix assisted laser desorption ionization-time of flight (MALDI-TOF) instruments have been commonly employed in mass spectrometry imaging (MSI) analyses and several studies have shown the use of this technique for the investigation of biomarkers in clinical studies [5-8]. Although this approach has also been applied to plant tissues revealing the spatial distribution of metabolites and proteins [9,10], its application is limited in studies involving plant-pathogen interaction. Some of these studies have focused on the detection or the distribution of defense molecules [11-15]; however, most protocols described so far, especially for the detection of proteins, involve cryosectioning [16-18].
Improvements in instrumentation and sample preparation have helped establish MALDI-MSI technique as a good choice for visualization of biomolecules in biological tissues [19]. Moreover, it has been widely used as a complementary tool in other classic studies, such as histology and molecular analyses [20]. Another application for MALDI-MSI is the differential analysis of healthy and infected tissues. Studies have applied this technique in mice models to identify inflammatory protein masses in tissues infected with Staphylococcus aureus [21] or during visceral leishmaniasis [8], however in plants it has been rarely used. Here, we describe a method for the detection of biomolecules (in the polypeptide m/z range) directly from the surface of leaves. We used as a model for this work the interaction between Arabidopsis thaliana and the bacterium Xanthomonas campestris pv. campestris (Xcc), the causal agent of black rot disease in cruciferous plants, in order to verify if differential proteins could be identified. We show the potential application of this tool in the detection of biomarkers associated with the infection caused by the bacterium, which could help in the development of strategies for pathogen detection and control.
Sample preparation
Plants of Arabidopsis thaliana (Columbia-0 ecotype) and the Xanthomonas campestris pv. campestris isolate 51 (Xcc 51), obtained from the culture collection of phytopathogenic bacteria of Embrapa Hortaliças, Brasilia, DF, Brazil, were used. A. thaliana seeds were sterilized in a solution of 70% ethanol/0.05% Triton X-100, dried using a filter paper and transferred to plates containing nutrient agar medium [Murashige and Skoog (MS) basal salt mixture (SIGMA-ALDRICH), 1% sucrose and 0.8% agar]. The plates were incubated in a growth chamber with 12 h light: 12 h dark cycles at a temperature of 22-24°C.
Seedlings of A. thaliana (3-4 week old) were inoculated with Xcc suspension (A600 = 0.1) prepared in distilled water. For the control condition, leaves were inoculated only with distilled water. Five days after inoculation, infected and mock-inoculated leaves were used for MALDI-MSI analysis. Leaf discs from 5 biological replicates were cut with the aid of a perforator (8 mm in diameter) and immersed in isopropanol/methanol 50% (v/v) solution for 5 s three times.
MALDI-MSI analysis
After drying in a vacuum desiccator for 5 min, leaf discs were fixed onto a MALDI target plate using double-sided adhesive/conductive tape. Then, 15 mL of a matrix solution (5 mg.mL-1 sinapinic acid in 50% ACN and 0.3% TFA) was deposited on the plant tissue using an artistic airbrush spraying device (Lee Pro Tools 601115) connected to nitrogen gas. For that, samples were placed 30 cm away from the spray jet and cycles during 3 s of spraying were intercalated with a 30 s drying time. After airbrush spraying, samples were dried under vacuum for 30 min followed by a final application of matrix solution (10 μL/leaf disc) performed with the aid of a pipette to ensure complete leaf disc coverage, as described previously [22]. After complete drying, the leaf discs were submitted to MALDI-TOF-MSI acquisition of proteins using an UltraFlex III mass spectrometer (Bruker Daltonics).
All mass spectra were acquired in the positive linear mode with laser (solid state) intensity fixed at 30% and using steps of 350 μm distance among the acquisition points and ablation diameter of 100 µm. Automatic scanning procedure was performed using FlexImaging 4.0 software (Bruker Daltonics). Global spectra were generated for each image from 200 laser shots at each position in the global maps. Ions were detected in the mass range of polypeptides, which is between m/z 1,740-25,000. External calibration was performed using a calibrant mixture (protein calibration standard I - Bruker) applied on a leaf disc, which was not used for subsequent analysis.
mage analysis
ImageJ software (1.50i 64-bit) was used to measure the area of ionic distribution obtained from FlexImagingTM software (Bruker). Colored images of each protein distribution were normalized using ImageJ software. The different pixels of black color were saturated, displaying white color and the areas were calculated. The data were used to evaluate the percentage occupied by the protein ion in comparison with the total leaf disc area. The mean and standard deviation were calculated for each ion and Student’s t-test with equal variances was used to identify significant changes on ionic distribution (p ≤ 0.05).
In this study we were interested in analyzing ion distribution directly on the leaf surface during a plant-pathogen interaction in an attempt to identify potential biomarkers associated to infected tissues. We used the model plant A. thaliana infected with X. campestris pv. campestris in order to optimize the detection of ions on the protein range using MALDI-MSI. Five days after inoculation (DAI), infected plants began to show chlorosis and V-shaped lesions, typical of black rot disease, while at 7 DAI severe symptoms could be observed (Figure 1). Since inoculated leaves at 7 DAI were very fragile, only leaves at 5 DAI were used and compared to the control condition. A total of 23 ions presented a minimum intensity threshold of 3, showing that this approach can be successfully applied for the detection of polypeptides directly on leaf tissue (Figure 2).
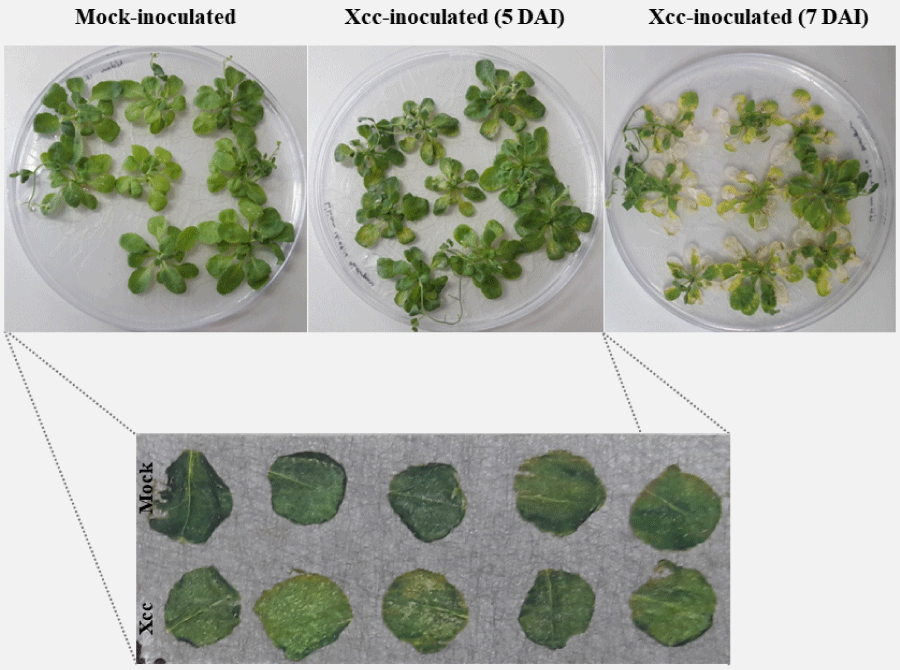
Figure 1: Symptoms in A. thaliana plants (3-4 week old) inoculated with Xantho-monas campestris pv. campestris (Xcc) showing chlorosis and necrosis at 5 and 7 days after inoculation (DAI), respectively.
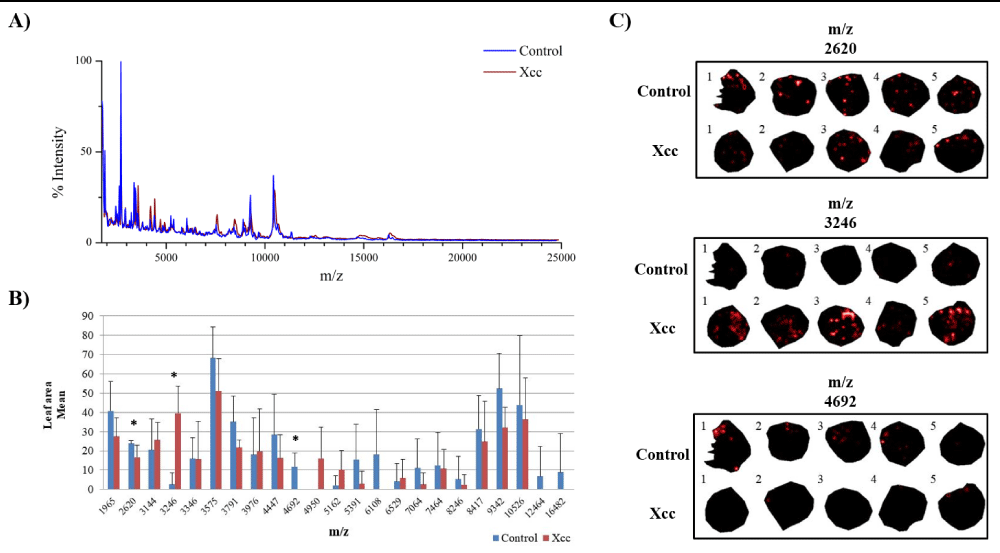
Figure 2: Potential protein biomarkers revealed in leaves of A. thaliana infected with Xanthomonas campestris pv. campestris (Xcc) using MALDI-MSI approach. A) Overlapping image of the global mass spectrum obtained from the acquisitions of MALDI-MSI in the control and Xcc inoculated leaves. B) Graph of the leaf area mean for each ion. (*) Statistically validated ions by Student’s t-test (p - value ≤ 0.05). C) Ions distributed in leaf discs inoculated with Xcc and in the control condition. The numbers 1, 2, 3, 4 and 5 represent the biological replicates.
When the Student’s t-test was applied, out of the 23 ions, 3 showed statistical significance (Figure 2). It is well known that MALDI-MSI presents variability in detection and therefore a high number of replicates is desirable. However, the amount of time necessary for data acquisition and processing also increase substantially. By analyzing the individual ion data (Table S1), we could observe that although only ions at m/z 2620, m/z 3246 and m/z 4692 were statistically validated, other ions could also be further investigated as interesting candidates to confirm their differential expression trend by other methods.
The use of MSI in plants has been reviewed by several authors [23-25], however few reports focused on plant-pathogen interactions. Previous studies have successfully revealed the tissue distribution of biological compounds, such as hesperidin that can be associated to defense mechanisms [15], as well as peptides/proteins in infected plants [26]. However, the detection of large biomolecules (m/z 1740-25000) directly from plant tissue is a challenge. In this study we present a simple method, optimized for the detection of large biomolecules directly from leaf tissue, without the need for cryosectioning. Our results show that MALDI-MSI approach can be a powerful tool for leaf-pathogen interaction studies, allowing the rapid detection of differentially abundant ions, which contributes for future studies aiming at the identification of proteins associated with defense and resistance in plants. The main contribution of this approach is that the spatial distribution of the detected ions is preserved, unlike other strategies applying multiple preparation steps, which may result in spatially displaced ions. For the first time, potential biomarkers associated with the infection caused by a pathogen are detected directly in leaf tissue by means of this technology. After further validation of these differential protein candidates by other methods, such as RT-qPCR, the corresponding genes can be used as targets for knockout or overexpression in plants aiming at the development of resistant cultivars or for the detection of infected plants.
Author contributions: LTS Carmo and DG Ribeiro performed the plant inoculation experiments and preparation of leaf tissue and wrote the manuscript. EA Barbosa and LP Silva performed the mass spectrometry analyses. A Mehta designed and supervised the experiments.
Funding
This research was funded by Embrapa (MP2 0209010260000), Conselho Nacional de Desenvolvimento Científico e Tecnológico – CNPq (Processo 478561/2012-1), Coordenação de Aperfeiçoamento de Pessoal de Nível Superior – CAPES (Programa Capes-Embrapa Edital nº 15/2014) and FAPDF.
We thank the Laboratory of Mass Spectrometry from Embrapa Recursos Genéticos e Biotecnologia for the support in the mass spectrometry analyses.
| Supplementary Table S1: Area of ions obtained in five leaf discs of A. thaliana using ImageJ software. | |||||||||||||||
| Ions | RC1 | RC2 | RC3 | RC4 | RC5 | Mean | Standard Deviation | RX1 | RX2 | RX3 | RX4 | RX5 | Mean | Standard Deviation | Student's t-test (p - value) |
| 1965 | 27.03 | 46.75 | 22.48 | 48.72 | 58.68 | 40.73 | 15.36 | 28.64 | 39.27 | 18.97 | 33.90 | 16.93 | 27.54 | 9.56 | 0.14 |
| 2620* | 22.73 | 22.99 | 24.42 | 22.82 | 26.25 | 23.84 | 1.51 | 17.06 | 9.23 | 26.16 | 15.79 | 15.29 | 16.71 | 6.09 | 0.03 |
| 3144 | 0.00 | 22.49 | 12.25 | 24.91 | 43.29 | 20.59 | 16.06 | 30.94 | 38.86 | 22.40 | 16.10 | 19.86 | 25.63 | 9.19 | 0.56 |
| 3246* | 0.00 | 0.01 | 0.00 | 0.01 | 13.51 | 2.71 | 6.04 | 47.73 | 34.37 | 46.82 | 17.42 | 51.53 | 39.57 | 13.97 | 0.00 |
| 3346 | 0.00 | 12.44 | 16.31 | 24.52 | 26.85 | 16.02 | 10.71 | 16.48 | 47.94 | 0.01 | 0.00 | 13.69 | 15.62 | 19.60 | 0.97 |
| 3575 | 55.85 | 54.24 | 59.93 | 86.19 | 85.05 | 68.25 | 15.99 | 58.84 | 76.35 | 35.97 | 44.86 | 39.19 | 51.04 | 16.64 | 0.13 |
| 3791 | 15.66 | 28.00 | 37.99 | 47.51 | 46.43 | 35.12 | 13.41 | 28.13 | 21.55 | 20.55 | 17.87 | 20.36 | 21.69 | 3.85 | 0.06 |
| 3976 | 0.00 | 0.01 | 14.66 | 38.57 | 37.33 | 18.11 | 19.08 | 0.01 | 47.55 | 13.15 | 0.00 | 37.95 | 19.73 | 21.95 | 0.90 |
| 4447 | 0.01 | 23.96 | 44.82 | 52.32 | 21.33 | 28.49 | 20.72 | 25.82 | 7.98 | 28.31 | 0.01 | 19.47 | 16.32 | 12.04 | 0.29 |
| 4692* | 16.02 | 10.71 | 16.84 | 15.80 | 0.00 | 11.87 | 7.06 | 0.00 | 0.00 | 0.00 | 0.00 | 0.01 | 0.00 | 0.00 | 0.01 |
| 4950 | 0.01 | 0.01 | 0.01 | 0.01 | 0.00 | 0.01 | 0.00 | 0.01 | 37.62 | 0.01 | 20.09 | 23.20 | 16.19 | 16.18 | 0.06 |
| 5162 | 0.00 | 0.00 | 0.01 | 10.80 | 0.01 | 2.17 | 4.83 | 15.37 | 0.00 | 22.71 | 12.86 | 0.01 | 10.19 | 9.98 | 0.14 |
| 5391 | 9.24 | 0.00 | 42.16 | 26.01 | 0.00 | 15.48 | 18.31 | 14.65 | 0.00 | 0.00 | 0.00 | 0.01 | 2.93 | 6.55 | 0.19 |
| 6108 | 17.07 | 0.00 | 17.71 | 56.50 | 0.00 | 18.26 | 23.08 | 0.01 | 0.00 | 0.00 | 0.00 | 0.01 | 0.00 | 0.00 | 0.11 |
| 6529 | 0.00 | 0.00 | 0.00 | 20.90 | 0.00 | 4.18 | 9.35 | 22.00 | 8.23 | 0.00 | 0.00 | 0.00 | 6.04 | 9.60 | 0.76 |
| 7064 | 0.01 | 10.21 | 0.01 | 36.89 | 8.54 | 11.13 | 15.15 | 13.21 | 0.01 | 0.00 | 0.00 | 0.00 | 2.64 | 5.91 | 0.28 |
| 7464 | 0.00 | 0.01 | 31.03 | 31.20 | 0.00 | 12.45 | 17.04 | 15.59 | 0.00 | 21.21 | 0.01 | 17.00 | 10.76 | 10.03 | 0.85 |
| 8246 | 0.00 | 0.00 | 0.01 | 26.54 | 0.00 | 5.31 | 11.87 | 0.00 | 0.00 | 0.01 | 0.00 | 12.07 | 2.42 | 5.40 | 0.63 |
| 8417 | 11.24 | 15.36 | 45.68 | 50.18 | 34.04 | 31.30 | 17.52 | 24.16 | 35.24 | 11.24 | 0.01 | 53.41 | 24.81 | 20.78 | 0.61 |
| 9342 | 52.84 | 32.71 | 67.49 | 73.10 | 36.20 | 52.47 | 18.07 | 49.82 | 28.11 | 25.98 | 23.79 | 32.57 | 32.05 | 10.45 | 0.06 |
| 10526 | 0.00 | 12.85 | 66.75 | 83.48 | 55.62 | 43.74 | 35.77 | 60.06 | 54.82 | 18.52 | 11.72 | 36.59 | 36.34 | 21.37 | 0.70 |
| 12464 | 0.00 | 0.00 | 0.01 | 34.55 | 0.00 | 6.91 | 15.45 | 0.00 | 0.00 | 0.00 | 0.00 | 0.00 | 0.00 | 0.00 | 0.35 |
| 16482 | 0.00 | 0.00 | 0.01 | 44.82 | 0.00 | 8.97 | 20.05 | 0.00 | 0.00 | 0.00 | 0.00 | 0.00 | 0.00 | 0.00 | 0.35 |
| The final value of the area was calculated using the ratio of the absolute value occupied by each ion in relation to leaf disc area. A total of 5 biological replicates were used. RC: number of replicates (control condition). RX: number of replicates (inoculated with Xanthomonas campestris pv. campestris) *Three protein ions showed a statistically significant differential profile (p ≤ 0.05). Protein ions highlighted in the table represent the ions statistically validated (p ≤ 0.05) when the two most discrepant values were removed. |
|||||||||||||||
- Dueñas ME, Feenstra AD, Korte AR, Hinners P, Lee YJ. Cellular and Subcellular Level Localization of Maize Lipids and Metabolites Using High-Spatial Resolution Maldi Mass Spectrometry Imaging. Methods Mol Biol. 2018; 1676: 217-231. PubMed: https://pubmed.ncbi.nlm.nih.gov/28986913/
- Solon EG, Schweitzer A, Stoeckli M, Prideaux B. Autoradiography, Maldi-Ms, and Sims-Ms Imaging in Pharmaceutical Discovery and Development. AAPS J. 2010; 12: 11-26. PubMed: https://pubmed.ncbi.nlm.nih.gov/19921438/
- Groseclose MR, Andersson M, Hardesty WM, Caprioli RM. Identification of Proteins Directly from Tissue: In Situ Tryptic Digestions Coupled with Imaging Mass Spectrometry. J Mass Spectrometry. 2007; 42: 254-262. PubMed: https://pubmed.ncbi.nlm.nih.gov/17230433/
- Michal A, Sabo J, Longuespée R. Microproteomic Sample Preparation. Proteomics. 2021: 2000318. PubMed: https://pubmed.ncbi.nlm.nih.gov/33547857/
- Balluff B, Elsner M, Kowarsch A, Rauser S, Meding S, et al. Classification of Her2/Neu Status in Gastric Cancer Using a Breast-Cancer Derived Proteome Classifier. J Prote Res. 2010; 9: 6317-6322. PubMed: https://pubmed.ncbi.nlm.nih.gov/21058730/
- Ermini L, Morganti E, Post A, Yeganeh B, Caniggia I, et al. Imaging Mass Spectrometry Identifies Prognostic Ganglioside Species in Rodent Intracranial Transplants of Glioma and Medulloblastoma. PLoS One. 2017; 12: e0176254. PubMed: https://pubmed.ncbi.nlm.nih.gov/28463983/
- Ucal Y, Durer ZA, Atak H, Kadioglu E, Sahin B, et al. Ozpinar. Clinical Applications of Maldi Imaging Technologies in Cancer and Neurodegenerative Diseases. Biochimica et Biophysica Acta. 2017; 1865: 795-816. PubMed: https://pubmed.ncbi.nlm.nih.gov/28087424/
- Jaegger CF, Negrão F, Assis DM, Belaz KRA, Angolini CFF, et al. Maldi Ms Imaging Investigation of the Host Response to Visceral Leishmaniasis. Mol Biosyst. 2017; 13: 1946-1953. PubMed: https://pubmed.ncbi.nlm.nih.gov/28758666/
- Kaspar S, Peukert M, Svatos A, Matros A, Mock HP. Maldi-Imaging Mass Spectrometry - an Emerging Technique in Plant Biology. Proteomics. 2011; 11: 1840-1850. PubMed: https://pubmed.ncbi.nlm.nih.gov/21462348/
- Sturtevant D, Lee YJ, Chapman KD. Matrix Assisted Laser Desorption/Ionization-Mass Spectrometry Imaging (Maldi-Msi) for Direct Visualization of Plant Metabolites in Situ. Curr Opin Biotechnol. 2016; 37: 53-60. PubMed: https://pubmed.ncbi.nlm.nih.gov/26613199/
- Araújo FD, Araújo WL, Eberlin MN. Potential of Burkholderia Seminalis Tc3.4.2r3 as Biocontrol Agent against Fusarium Oxysporum Evaluated by Mass Spectrometry Imaging. J Am Society Mass Spectrometry. 2017; 28: 901-907. PubMed: https://pubmed.ncbi.nlm.nih.gov/28194740/
- Kim W, Park JJ, Dugan FM, Peever TL, Gang DR, et al. Production of the Antibiotic Secondary Metabolite Solanapyrone a by the Fungal Plant Pathogen Ascochyta Rabiei During Fruiting Body Formation in Saprobic Growth. Environ Microbiol. 2017; 19: 1822-1835. PubMed: https://pubmed.ncbi.nlm.nih.gov/28109049/
- Slazak B, Kapusta M, Malik S, Bohdanowicz J, Kuta E, et al. Immunolocalization of Cyclotides in Plant Cells, Tissues and Organ Supports Their Role in Host Defense. Planta. 2016; 244: 1029-1040. PubMed: https://pubmed.ncbi.nlm.nih.gov/27394154/
- Klein AT, Yagnik GB, Hohenstein JD, Ji Z, Zi J, et al. Investigation of the Chemical Interface in the Soybean-Aphid and Rice-Bacteria Interactions Using Maldi-Mass Spectrometry Imaging. Anal Chem. 2015; 87: 5294-5301. PubMed: https://pubmed.ncbi.nlm.nih.gov/25914940/
- Soares MS, da Silva DS, Forim MR, da Silva MF, Fernandes JB, et al. Machado. Quantification and Localization of Hesperidin and Rutin in Citrus Sinensis Grafted on C. Limonia after Xylella Fastidiosa Infection by Hplc-Uv and Maldi Imaging Mass Spectrometry. Phytochemistry. 2015; 115: 161-170. PubMed: https://pubmed.ncbi.nlm.nih.gov/25749617/
- Julia G, Taylor NL, Millar AA. Matrix-Assisted Laser Desorption/Ionisation Mass Spectrometry Imaging and Its Development for Plant Protein Imaging. Plant Methods. 2011; 7: 21. PubMed: https://pubmed.ncbi.nlm.nih.gov/21726462/
- Poth AG, Mylne JS, Grassl J, Lyons RE, Millar A, et al. Cyclotides Associate with Leaf Vasculature and Are the Products of a Novel Precursor in Petunia (Solanaceae). J Biol Chem. 2012; 287: 27033-27046. PubMed: https://pubmed.ncbi.nlm.nih.gov/22700981/
- Erin G, Keller C, Jayaraman D, Maeda J, Sussman MR, et al. Examination of Endogenous Peptides in Medicago Truncatula Using Mass Spectrometry Imaging. J Prote Res. 2016; 15: 4403-4411. PubMed: https://pubmed.ncbi.nlm.nih.gov/27726374/
- Eriksson C, Masaki N, Yao I, Hayasaka T, Setou M. Maldi Imaging Mass Spectrometry-a Mini Review of Methods and Recent Developments. Mass Spectrometry (Tokyo). 2013; 2: S0022. PubMed: https://pubmed.ncbi.nlm.nih.gov/24349941/
- Longuespée R, Casadonte R, Kriegsmann M, Pottier C, Picard de Muller G, et al. Maldi Mass Spectrometry Imaging: A Cutting-Edge Tool for Fundamental and Clinical Histopathology. Proteomics Clin Appl. 2016; 10: 701-719. PubMed: https://pubmed.ncbi.nlm.nih.gov/27188927/
- Attia Ahmed S, Schroeder KA, Seeley EH, Wilson KJ, Hammer ND, et al. Monitoring the Inflammatory Response to Infection through the Integration of Maldi Ims and Mri. Cell Host & Microbe. 2010; 11: 664-673. PubMed: https://pubmed.ncbi.nlm.nih.gov/22704626/
- Alves BE, Bonfim MF, Bloch C, Engler G, Rocha T, et al. Imaging Mass Spectrometry of Endogenous Polypeptides and Secondary Metabolites from Galls Induced by Root-Knot Nematodes in Tomato Roots. Molecular Plant-Microbe Interactions. 2018; 31: 1048-1059. PubMed: https://pubmed.ncbi.nlm.nih.gov/29663868/
- Boughton Berin A, Thinagaran D, Sarabia D, Bacic A, Roessner U. Mass Spectrometry Imaging for Plant Biology: A Review. Phytochem Rev. 2016; 15: 445-488. PubMed: https://pubmed.ncbi.nlm.nih.gov/27340381/
- Yonghui D, Li B, Malitsky S, Rogachev I, Aharoni A, et al. Sample Preparation for Mass Spectrometry Imaging of Plant Tissues: A Review. Front Plant Sci. 2016; 7: 60. PubMed: https://pubmed.ncbi.nlm.nih.gov/26904042/
- Nanna B, Li B, D'Alvise J, Janfelt C. Mass Spectrometry Imaging of Plant Metabolites – Principles and Possibilities. Nat Prod Rep. 2014; 31: 818-837. PubMed: https://pubmed.ncbi.nlm.nih.gov/24452137/
- Debois D, Jourdan E, Smargiasso N, Thonart P, De Pauw E, et al. Spatiotemporal Monitoring of the Antibiome Secreted by Bacillus Biofilms on Plant Roots Using Maldi Mass Spectrometry Imaging. Anal Chem. 2014; 86: 4431-4438. PubMed: https://pubmed.ncbi.nlm.nih.gov/24712753/