Research Article
Evaluation of genetic diversity in germplasm of paprika (Capsicum spp.) using random amplified polymorphic DNA (RAPD) markers
Renganathan P1, Ruíz-Alvarado C2, Hernández-Montiel LG3, Prasath Duraisamy4 and Rueda-Puente EO5*
1Department of Plant Biotechnology, School of Life Science, Bharathidasan University, Trichy, Tamilnadu, India
2Instituto de Ciencias Agrícolas de la Universidad Autónoma de Baja California, México
3Centro de Investigaciones Biológicas del Noroeste. CIBNOR. La Paz, B.C.S. México
4Indian Institute of Spices Research, Indian Council of Agriculture Research, Calicut, Kerala, India
5Departamento de Agricultura y Ganadería, Universidad de Sonora, Hermosillo, Sonora, México
*Address for Correspondence: Rueda-Puente EO, Departamento de Agricultura y Ganadería, Universidad de Sonora, Hermosillo, Sonora, México. E-mail: [email protected]
Dates: Submitted: 16 September 2017; Approved: 26 September 2017; Published: 27 September 2017
How to cite this article: Renganathan P, Ruíz-Alvarado C, Hernández-Montiel LG, Duraisamy P, Rueda-Puente EO. Evaluation of genetic diversity in germplasm of paprika (Capsicum spp.) using random amplified polymorphic DNA (RAPD) markers. J Plant Sci Phytopathol. 2017; 1: 080-086.
DOI: 10.29328/journal.jpsp.1001010
Copyright License: © 2017 Renganathan P, et al. This is an open access article distributed under the Creative Commons Attribution License, which permits unrestricted use, distribution, and reproduction in any medium, provided the original work is properly cited.
Keywords: Polymorphism; Similarity; Genetic variations; Molecular markers
Abstract
Capsicum spp. is one of the most important economical horticulture crops due to its high consumption either by fresh vegetable or dried spice. Molecular genetic markers offer a number of applications in the genetic improvement of crop plants, which plays an important role in the areas of plant classification and breeding programs. The polygenetic characters of rare species, which are difficult to analyze by traditional methods can, be analyzed easily and classified by using molecular markers. In our study, genetic relationships of twenty-two paprika species were examined to estimate their genetic variations/similarities and to detect the polymorphism present within and among the paprika species by using RAPD-PCR markers. The results revealed that the maximum similarities among the 16 ICBD lines were 100%. The ICBD 03 had 76% similarity compared with other ICBD lines. The CC01 had comparatively low similarity with ICBD forms (30%), followed by EC01 (28%), EC02 (33%), CC02 (35%), and Kt.Pl-19 (60%). The similarity between EC01 and EC02 were 54%. Kt.Pl-19 showed different similarities compared to CC01 (41%), CC02, EC01 (38%), EC02 (29%) and ICBD 03 (40%). The different combinations were tried to optimize the RAPD-PCR profile, which helped to assessing the polymorphism/similarities within and among the Paprika germoplasms were studied.
Introduction
Peppers and pepper fruits (Capsicum spp.) represent an important part of the fresh vegetable market in India, and are also significant worldwide in the segment of condiments, spices and salt preserves [1-3]. Among them, five domesticated species have been globally recognized which includes C. annuum L., C. frutescens L., C. chinense Jacq., C. baccatum Jacq., and C. pubescens (4). C. annuum continues to be the most popular and important species, the next being C. frutescens [5,6]. Some varieties are famous for red color because of the pigment capsanthin, others are known for biting pungency attributed by capsaicin [7-9]. Paprika (Capsicum spp.) is the ground product from the mild or sweet varieties of Capsicum, whereas red and chili peppers are blends of different varieties of more pungent peppers [10,11]. Consideration and assessment of genetic variability existing in a population is the basic requirement for any effective crop improvement program. Germplasm characterization is an important link between the conservation and utilization of plant genetic resources. Molecular DNA techniques allow researchers to identify accessions at the taxonomic level and assess the relative diversity within and among the species [12]. Molecular markers are important tool for breeding selection, genotype identification and studying the organization and evolution of plant genomes [13]. Randomly Amplified Polymorphic DNA (RAPD) is attractive for less-known species and widely used for describing levels and patterns of diversity and genetic structure in a number of plant species [12,13]. RAPD analysis has been found to be effective in varietal identification of several crops including lily, Capsicum, eggplant, Chrysanthemum, mulberry, Jatropha, castor bean and Cymbopogon [14-16]. Our present investigation was undertaken to assess the genetic variability among the paprika germplasms conserved at Indian Institute of Spices Research, Calicut using RAPD markers with the following objectives: [1] to estimate genetic relationship among the paprika accessions; and [2] to detect the polymorphism present within and among the accessions.
Materials and Methods
Experimental site
All experiments were conducted at Laboratory of Plant Breeding, Division of Crop Improvement and Biotechnology, Indian Institute of Spices Research (IISR), Kozhikode, Kerala, India.
Plant materials and reagents
Fresh young leaves of 22 paprika genotypic accessions ICBD 01, ICBD 02, ICBD 03, ICBD 04, ICBD 05, ICBD 06, ICBD 07, ICBD 08, ICBD 09, ICBD 10, ICBD 11, ICBD 12, ICBD 15, ICBD 16, ICBD 17, ICBD 19, ICBD 20, CC 01, CC 02, Kt.Pl-19v, EC 01, and EC 02, which had been maintained by IISR germplasm, were studied. Reagents used for the experiments were of molecular biology grade and were procured from Sigma Chemical Company, USA. Glasswares and buffers prepared in Milli-Q water were sterilized by autoclaving at 15 lbs for 15 min.
Genomic DNA extraction
Total genomic DNA was extracted from fresh young and disease free leaves of 22 paprika accessions by using a modified version of CTAB method described by Doyle (18). 10-15 ml of CTAB buffer containing 2% CTAB (trimethylammonium bromide), 5 M NaCl, 2-mercaptoethanol, 0.5 EDTA, 1M Tris-HCl (pH 8.0), 2% PVP was added to 50 ml Oak Ridge tube and preheated for 20 min at 65°C in a water bath. Ground 2 g of fresh leaf tissue into fine powder with the help of mortar and pestle after freezing in liquid nitrogen, and it was transferred to the Oak Ridge tube containing preheated CTAB buffer solution. Incubate the sample at 65°C for 15-60 min with optional occasional gentle swirling. After incubation, add equal volume of chloroform:isoamyl alcohol (24:1), mix gently but thoroughly for 15 min. The tubes were centrifuged at 10,000 rpm for 15 min at 4°C. Removed the aqueous phase with wide bore pipette, transferred to clean Oak Ridge tube, added 2/3 volumes of ice-cold isopropanol, and mix gently to precipitate the DNA. The tubes were centrifuged at 10,000 rpm for 15 min at 4°C and discard the supernatant. DNA pellet was washed with 70% ethanol and allowed the DNA pellet to air dry at room temperature. Finally, the pellet was dissolved with 500 µl of nuclease free distilled water and was transferred to micro centrifuge tubes.
DNA purification
Two microlitre of RNase enzyme was added to micro centrifuge tubes containing dissolved extracted total genomic DNA, mixed gently and incubated for 1 h at 37°C in a water bath with intermittent shaking. After incubation, equal volume of phenol:chloroform:isoamyl alcohol (25:24:1) was added. Mixed thoroughly and centrifuged at 10,000 rpm for 10 min at 4°C. And the supernatant was transferred to a fresh micro centrifuge tube. Equal volume of chloroform:isoamyl alcohol (25:1) was added to the supernatant, mixed well and centrifuged at 10,000 rpm for 10 min at 4°C. Supernatant was collected to a fresh tube and add 100% ice-cold alcohol and stored at 4°C for 1 h to precipitate DNA. Precipitated DNA was collected by centrifugation at 10,000 rpm for 10 min at 4°C and washed with 70% ethanol and dried. The dried pellet was dissolved with 100 µl of nuclease free water, the DNA was dissolved and stored at -20°C. The quality of the extracted DNA was determined by taking the ratio of absorbance at 260 nm and 280 nm.
DNA quantification
The DNA was quantified on 1% agarose gel in 1x TAE buffer was prepared with 1.5 µl of ethidium bromide. 2 µl of λ DNA ladder was loaded as marker. 5 µl of DNA samples were loaded with 3 µl of gel loading dye. Gel electrophoresis was carried out for 90 min at 60-80 volts. The DNA bands were visualized on a UV Trans illuminator and the gel was documented by gel documentation system (Alpha Image 1220).
RAPD-PCR amplification
The primer´s used for RAPD-PCR were listed in table 1. The PCR reactions were set up in a 25 µl reaction containing 45 ng genomic DNA, 1X PCR reaction buffer containing 25 mM MgCl2, 5 pmols primer, 10 mM each of dCTP, dGTP, dTTP and dATP and 1U of Taq DNA polymerase (Perkin Elmer). Amplification was performed on a thermal cycler (Model 2 400, Perkin Elmer) with a programme of initial denaturation cycle at 94ºC for 3 min, denaturation at 94ºC for 1 min, annealing at 37ºC for 1 min, extension at 72ºC for 2 min, and final extension at 72ºC for 7 min with 35 cycle repeats. The amplification products were electrophoresed on a (Owl Electrophoresis Unit) 2% agarose gel (Genei Q Biogene) with a standard DNA marker (1kb DNA ladder) at 67V for 2 h stained by ethidium bromide (1.5 µl/ml) and photographed by using gel documentation system (Alpha Image 1220).
| Table 1: The primers used to amplification for RAPD-PCR, indicating the sequences and percentage of guanine-cytosine content. | |||
| No. | Primer | Sequence | GC content (%) |
| 1 | OPA 04 | 5’AATCGGGCTG3’ | 60 |
| 2 | OPA 05 | 5’AGGGGTCTTG3’ | 60 |
| 3 | OPA 06 | 5’GGTCCCTGAC3’ | 70 |
| 4 | OPA 11 | 5’CAATCGCCGT3’ | 60 |
| 5 | OPA 16 | 5’AGCCAGCGAA3’ | 60 |
| 6 | OPA 17 | 5’GACCGCTTGT3’ | 60 |
| 7 | OPA 18 | 5’AGGTGACCGT3’ | 60 |
| 8 | OPA 19 | 5’CAAACGTCGG3’ | 60 |
| 9 | OPB 01 | 5’GTTTCGCTCC3’ | 60 |
| 10 | OPB 06 | 5’TGCCGAGCTG3’ | 70 |
| 11 | OPB 07 | 5’GGTGACGCAG3’ | 70 |
| 12 | OPB 09 | 5’TGGGGGACTC3’ | 70 |
| 13 | OPB 11 | 5’GTAGACCCGT3’ | 60 |
| 14 | OPB 15 | 5’GGAGGGTGTT3’ | 60 |
| 15 | OPB 19 | 5’ACCCCCGAAG3’ | 70 |
| 16 | OPC 08 | 5’TGGACCGGTG3’ | 70 |
| 17 | OPC 09 | 5’CTCACCGTCC3’ | 70 |
| 18 | OPC 10 | 5’TGTCTGGGTC3’ | 60 |
| 19 | OPC 16 | 5’CACACTCCAG3’ | 60 |
| 20 | OPC 18 | 5’TGAGTGGGTG3’ | 60 |
| 21 | OPC 20 | 5’ACTTCGCCAC3’ | 60 |
| 22 | OPD 08 | 5’GTGTGCCCCA3’ | 70 |
Data analysis
The electrophoretic pattern was visually analyzed and DNA bands were scored as present [1] or absent (0). The matrix obtained was entered into NTSYS-pc program [19] and Jaccard’s Similarity Index (JSI) was calculated to each pair of samples. A UPGMA dendrogram was constructed based on JSI.
Results and Discussion
We determined the genetic variations/similarities among the twenty-two paprika accessions of various types. The results are conformity with [20,21]. The application of molecular markers in the improvement of Capsicum species for characterization of the genotypes, genetic fingerprinting, identification and cloning of important genes, marker assisted selection and in understanding of inter-relationships at molecular level. RAPD markers have been extensively used in assessing genetic variation and taxonomic relatedness of both wild and cultivated species [22-24]. RAPD markers can be efficient in the routine assessment of variety identification and of hybrid seed purity in pepper [25,26].
The evolutionary relationships among and within the cultivated Capsicum species have been investigated in several studies, using morphological, cytogenetically and molecular markers [20,27]. RAPD markers have also been used to determine evolutionary relationships and levels of genetic variation among wild and cultivated populations of a number of crop species, including Capsicum species [20,21]. In the present study, the total genomic DNA was extracted from the young and fresh leaves of twenty-two paprika accessions by using modified version of CTAB method. The quality of extracted DNA samples were tested on 1% agarose gels along with standard λ DNA. The DNA yield ranged from 25-250 ng/µl. Though comparison with standard λ DNA marker indicated high molecular weight DNA, a considerable amount of RNA contamination was found in some of the extracted DNA samples of paprika. In order to eliminate or reduced the RNA contamination. The DNA samples were treated with RNase enzyme followed by phenol:chloroform:isoamyl alcohol extraction. Different combinations and concentrations of Taq DNA Polymerase (1U, 2U and 3U per 25µl reaction volume) and MgCl2 (25mM and 50mM per 25µl reaction volume) were tried for good RAPD-PCR amplification. Among the different combinations, 1U of Taq DNA Polymerase and 25 mM MgCl2 concentration offered amplification with clear bands without non-specific banding. Hence, 45ng of DNA, 10 X Assay buffer, 25 mM of MgCl2, 10mM of dNTP, 1U of Taq Polymerase were optimized for generating a consistent RAPD-PCR amplification.
The two temperature profiles were tested for optimizing the PCR conditions with the initial denaturation cycle at 94ºC for 3 min, denaturation at 94ºC for 1 min, annealing at 40ºC for 1 min, extension at 72ºC for 2 min and final extension at 72ºC for 7 min with 38 cycle repeats (reaction I) and initial denaturation cycle at 94ºC for 3 min, denaturation at 94ºC for 1 min, annealing at 37ºC for 1 min, extension at 72ºC for 2 min and final extension at 72ºC for 7 min with 35 cycle repeats (reaction II). Among the two reaction profiles, the amplification products and number of amplified bands were generated more under reaction II than reaction I. In the second reaction profile, the primer annealing time was with 1 min at 37ºC. i.e., the stringency of the reaction was reduced from 40ºC to 37ºC. Also the cycle repeats were reduced from 38 to 35. Twenty two Operon decamer primers were used for assessing the polymorphism/similarities within and among the Paprika accessions. The primer OPB-07 showed a consistent band around 600 bp in almost all accessions. Similarly, OPD-02 showed a consistent band around 1 kb and as well as OPA-06 around 500 bp. These common bands may represent the genetic characters of Capsicum sp. An example of the amplified pattern obtained with one RAPD primer is presented in figue 1. Seven polymorphic bands were observed with OPA-04 with the amplicon size ranged from 250 to 2000 bp (Figure 1). The bands from 400 to 1300 bp were found to be polymorphic. Similarities in the banding pattern were noticed between the ICBD accessions around 800 bp. On the other hand, five polymorphic bands were observed at other five accessions (CC 01, CC 02, Kt.Pl-19, EC 01 and EC 02). Seven polymorphic bands were observed with OPA-05. The amplicon size ranged from 250 to 2500 bp. The bands from 600 to 1500 bp were found to be polymorphic. The results are conformity with [20,21]. Amplification with quality was observed and the maximum numbers of amplified bands were nine with OPA-11. Similarities in patterns were noticed in the ICBD accessions. The patterns were also similar with minor differences in ICBD03 around 800 bp with the amplicon size ranged from 250 to 2500 bp. The bands from 300 to 1600 bp were found to be polymorphic. On the other hand, nine polymorphic bands were observed at other five accessions (CC 01, CC 02, Kt.Pl-19, EC 01 and EC 02).
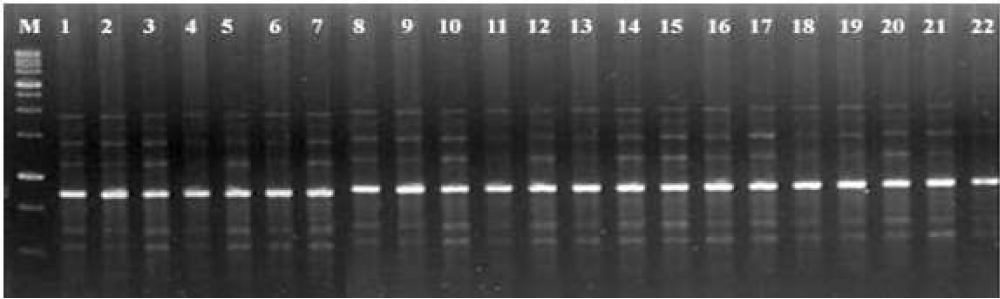
Figure 1: Amplification patterns obtained from 22 paprika accessions using RAPD primer OPA 04. Lane numbers are represented in the order of ICBD 01, ICBD 02, ICBD03, ICBD04, ICBD 05, ICBD 06, ICBD 07, ICBD 08, ICBD 09, ICBD 10, ICBD 11, ICBD 12, ICBD 15, ICBD 16, ICBD 17, ICBD 19, ICBD 20, CC 01, CC 02, Kt.Pl -19, EC 01 and EC 02 paprika accessions. M: 1 kb size marker.
The UPGMA cluster dendrogram constructed based on the Jaccard’s Similarity Index (JSI) showed a single cluster with seven groups (Figure 2). The first, second, third, fourth, fifth and sixth groups comprised of CC 01, EC 02, EC 01, CC 02, Kt.Pl-19 and ICBD 03. The seventh group comprised of 16 Paprika accessions ICBD 01, ICBD 02, ICBD 04, ICBD 05, ICBD 06, ICBD 07, ICBD 08, ICBD 09, ICBD 10, ICBD 11, ICBD 12, ICBD 15, ICBD 16, ICBD 17, ICBD 18, ICBD 19, and ICBD 20. All these types showed maximum similarities (100%) within them. It is interesting to note that the ICBD 03 did not cluster with other ICBD lines and had only 76% similarity with other ICBD lines. The CC 01 had comparatively low similarity with ICBD lines (30%), followed by EC 01 (28%), EC 02 (33%), CC 02 (35%), and Kt.Pl.-19 (60%). The similarity between EC 01 and EC 02 was 54%. CC1 showed 38% similarity with CC 02. Kt.Pl-19 showed different similarities with other paprika accessions such as CC 01 (41%), CC 02, EC 01 (38%), EC 02 (29%) and ICBD3 (40%).
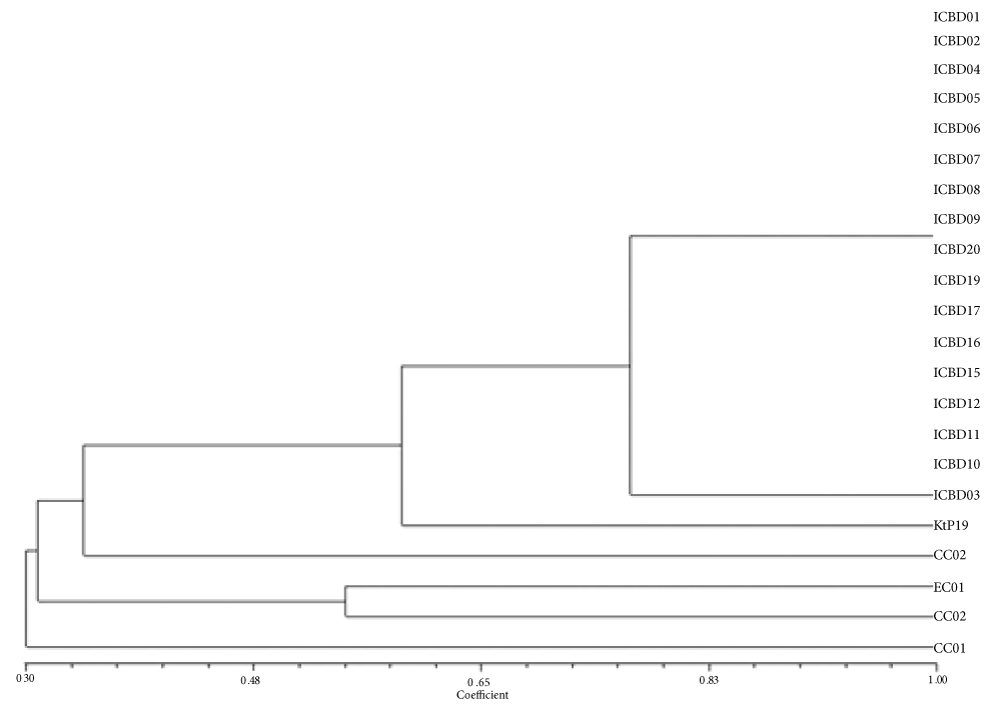
Figure 2: Cluster dendrogram of 22 pepper accessions was constructed based on the Jaccard’s Similarity Index (JSI).
Conclusions
The modified protocol used for the isolation of DNA was found to be suitable for Paprika, which showed quality DNA from the leaves. Among the different combinations tried to optimize the PCR profile, which helped to give amplification with quality and clear bands without non-specific banding. Cluster dendrogram revealed maximum similarities/polymorphism were observed within the 16 ICBD accessions except ICBD 03. Apart from ICBD line, other accessions like EC 01, EC 02, CC 01, CC 02, and Kt.Pl had comparatively low similarity with ICBD forms.
Acknowledgements
The authors wish to thank P.S. Hareesh, V. Bhadra Murthy, Syam kumar, Siju Senan for their immense help, valuable advices and co-operation during the study. This work was supported by the Indian Institute of Spices research, which it is a contribution from the Indian Agricultural Research Institute (IARI).
References
- Ananthan R, Subash K, Longvah T. Assessment of nutrient composition and capsaicinoid content of some red chilies. International Proceedings of Chemical. Biological and Environmental Engineering. 2014. 72, 1-4. Ref.: https://goo.gl/YLfJDM
- Baas-Espinola FM, Castro-Concha LA, Vázquez-Flota FA, Miranda-Ham M. Capsaicin synthesis requires in situ phenylalanine and valine formation in in vitro Maintained Placentas from Capsicum chinense. Molecules. 2016; 21: 799. Ref.: https://goo.gl/8aaog3
- Barbero GF, Liazid A, Palma M, Barroso CG. Ultrasound-assisted extraction of capsaicinoids from peppers. Talanta. 2008; 75: 1332-1337. Ref.: https://goo.gl/wc7h2J
- Barbero GF, Ruiz AG, Liazid A, Palma M, Vera JC, et al. Evolution of total and individual capsaicinoids in peppers during ripening of the Cayenne pepper plant (Capsicum annuum L.). Food Chemistry. 2014; 153: 200-206. Ref.: https://goo.gl/2N9Nheb
- Conforti F, Statti GA, Menichini F. Chemical and biological variability of hot pepper fruits (Capsicum annuum var. acuminatum L.) in relation to maturity stage. Food Chemistry. 2007; 102: 1096-1104. Ref.: https://goo.gl/DCwrww
- Garcés-Claver A, Arnedo-Andrés MS, Abadía J, Gil-Ortega R, ÁlvarezFernández A. Determination of Capsaicin and Dihydrocapsaicin in Capsicum Fruits by Liquid ChromatographyElectrospray/Time-of-Flight Mass Spectrometry. Journal of Agricultural and Food Chemistry. 2006; 54: 9303-9311. Ref.: https://goo.gl/CmfyJS
- Gnayfeed MH, Daood HG, Biacs PA, Alcaraz CF. Content of bioactive compounds in pungent spice red pepper (paprika) as affected by ripening and genotype. Journal of the Science of Food and Agriculture. 2001; 81: 1580-1585. Ref.: https://goo.gl/aTnLYK
- Govindarajan VS, Rajalakshmi D, Chand N, Salzer UJ. Capsicum-Production, technology, chemistry, and quality. Part IV. Evaluation of quality. Critical Reviews in Food Science & Nutrition. 1987; 25: 185-282. Ref.; https://goo.gl/Dpbq1D
- Islam MA, Sharma SS, Sinha P, Negi MS, Neog B, et al. Variability in capsaicinoid content in different landraces of Capsicum cultivated in north-eastern India. Scientia Horticulturae. 2015; 183: 66-71. Ref.: https://goo.gl/9oX227
- Kim S, Park J, Hwang IK. Changes in FA composition and antioxidative activity of pigment extracts from Korean red pepper powder (Capsicum annuum L.) due to processing conditions. Journal of the American Oil Chemists’ Society. 2002; 79: 1267-1270. Ref.: https://goo.gl/xw97qF
- Kozukue N, Han JS, Kozukue E, Lee SJ, Kim JA, et al. Analysis of eight capsaicinoids in peppers and pepper-containing foods by High-Performance Liquid Chromatography and Liquid Chromatography-Mass Spectrometry. Journal of Agricultural and Food Chemistry. 2005; 53: 9172-9181. Ref.: https://goo.gl/NqU9fH
- Blum E, Liu K, Mazourek M, Yoo EY, Jahn M, et al. Molecular mapping of the C locus for presence of pungency in Capsicum. Genome. 2002; 45: 702-705. Ref.: https://goo.gl/qytHft
- Karp A, Seberg O, Buiatti M. Molecular techniques in the assessment of botanical diversity. Annals Botany. 199; 78: 143-149. Ref.: https://goo.gl/Dd3zKB
- Edwards K, Johnstone C, Thompson C. A simple and rapid method for the preparation of plant genomic DNA for PCR analysis. Nucleic Acids Res. 1991. 19: 1349. Ref.: https://goo.gl/sEhjm7
- Marín A, Ferreres F, Tomás-Barberán FA, Gil MI. Characterization and quantitation of antioxidant constituents of sweet pepper (Capsicum annuum L.). Journal of Agricultural and Food Chemistry. 2014; 52: 3861-3869. Ref.: https://goo.gl/k98iub
- Tingey SV, Rafalski JA, Williams SJK. Genetic analysis with RAPD markers. In Proceedings of the Symposium on Application of RAPD Technology to Plant Breeding. Crop Science Society of America. Minneapolis MN. 1992.
- Staub J, Sequen FC. Genetic markers, map construction and their application in plant breeding. Horticultural Science. 1996; 31: 724-740. Ref.: https://goo.gl/HE5Gq3
- Doyle JJ, Doyle JL. Isolation of plant DNA from fresh tissue. Focus. 1990; 12: 13-15. Ref.: https://goo.gl/vWvYrR
- Rohlf EJ. NTSYS-pc: numerical taxonomy and multivariate analysis system, version 1.80. Applied Biostatistics Inc., Setauket. 1993.
- Lefebvre V, Palloix A, Caranta C, Pochard E. Construction of an intra specific integrated linkage map of pepper using molecular markers and doubled haploid progenies. Genome. 1995; 38: 112-121. Ref.: https://goo.gl/SoeRsC
- Rodriguez JM, Berke T, Engle L, Nienhuis J. Variation among and within Capsicum species revealed by RAPD markers. Theoretical and Applied Genetics. 1999; 99: 147-156. Ref.: https://goo.gl/aTk3nk
- Palacios C, González-Candelas F. Analysis of population genetic structure and variability using RAPD markers in the endemic and endangered Limonium dugourii (Plumbaginaceae). Molecular Ecology. 1997; 6: 1107-1121. Ref.: https://goo.gl/z3cX2T
- Cardoso SRS, Eloy NB, Provan J, Cardoso MA, Ferreira PC. Ferreira.Genetic differentiation of Euterpe edulis Mart. populations estimated by AFLP analysis. Molecular Ecology. 2000. 9: 1753-1760. Ref.: https://goo.gl/oWzNtR
- Gaudel M, Taberlet P, Till-Bottraud I. Genetic diversity in an endangered alpine plant Eryngium alpinum L. (Apiaceae), inferred from amplified fragment lenght polymorphism markers. Molecular Ecology. 2000; 9: 1625-1637. Ref.: https://goo.gl/wakDtb
- Ballester J, Vicente C. Determination of F1 hybrid seed purity in pepper using PCR-based markers. Euphytica. 1998. 103: 223-226. Ref.: https://goo.gl/iZ2PMN
- Zhou QC, Ma YQ, Zhang ZQ, Li XF, Ai X. Purity determination of pepper hybrid by randomly amplified polymorphic technique. J Hunan Agricul University. 1999; 25: 95-98.
- Prince JP, Lackney VK, Angeles C, Blauth JR, Kyle MM. A survey of DNA polymorphism within the genus Capsicum and the fingerprinting of pepper cultivars. Genome. 1995; 38: 224-231. Ref.: https://goo.gl/ndTZm5