
More Information
Submitted: July 25, 2025 | Approved: July 31, 2025 | Published: August 01, 2025
How to cite this article: Tefera H. Phenotypic Evaluation and Agronomic Adaptation of High-yielding Desi-type Chickpea (Cicer artinum L) Varieties at Wegdi and Legambo Districts of South Wollo, Ethiopia. J Plant Sci Phytopathol. 2025; 9(2): 052-061. Available from:
https://dx.doi.org/10.29328/journal.jpsp.1001156
DOI: 10.29328/journal.jpsp.1001156
Copyright license: © 2025 Tefera H. This is an open access article distributed under the Creative Commons Attribution License, which permits unrestricted use, distribution, and reproduction in any medium, provided the original work is properly cited.
Keywords: Desi-type; Chickpea; Correlation; Genotype; Phenotype; Variance
Abbreviations: DF: Days to Flowering; DM: Days to Maturity; PB: Primary Branch; SB: Secondary Branch; PH: Plant Height; PPl: Pods per Plant; SP: Seeds per Pod; SPl: Seeds per Plant; HW: Hundred Seed Weight; BY: Biomass Yield; GY: Grain Yield; HI: Harvest Index

Phenotypic Evaluation and Agronomic Adaptation of High-yielding Desi-type Chickpea (Cicer artinum L) Varieties at Wegdi and Legambo Districts of South Wollo, Ethiopia
Haile Tefera*
Department of Plant Science, College of Agriculture and Natural Resources, Mekdela Amba University, Ethiopia
*Address for Correspondence: Haile Tefera, Department of Plant Science, College of Agriculture and Natural Resources, Mekdela Amba University, Ethiopia, Email: [email protected]
Background: Chickpea (Cicer arietinum L.) (Chromosome number = 16) originated in southeastern Turkey and the boundary of Syria. A cultivation of low-yield homegrown chickpea cultivars is an unruly part of pulse crop production within Ethiopia. Consequently, this exploration is planned to examine the variability plus adaptability of Desi-type pulse cultivars aimed at harvest plus harvest constituent behaviors.
Approaches: A research was conducted by ten Desi-type plus cultivars, plus constructed a randomized complete block design was constructed by individual area through an organization of 3 by 10 treatments.
Outcomes: Acquired on erraticism evaluation, association among harvest-allied behaviors, constant of alteration, heritability, plus genomic improvement of behaviors existing at this point in the research. Investigation of deviation indicated extremely significant variation among varieties for the entire traits at every location. The mean seed yields were Aqaqi with a mean of 2727 and 2727 kg, Dalota with a mean of 4505 and 4883 kg, Dimtu with a mean of 4797 and 4899 kg, Fetenech with a mean of 2333 and 2333 kg, Mestawel with a mean of 4134 and 4367 kg, Minjar with a mean of 2927 and 2927 kg, Mitk with a mean of 2536 and 2536 kg, Natoli with a mean of 3690 and 4233 kg, Kutaye with a mean of 2883 and 2883 kg, and Teketai with a mean of 2647 and 2763 kg. Wide-ranging heritability ranged from 68.2% to 99.91% in this study.
Conclusion: From the tested varieties, Dalota, Dimtu, Mestawel, and Natoli were recommended materials to distribute to farmers in Legambo and Wegdi Districts, respectively.
Chickpea (Cicer arietinum L.) (Chromosome number = 16) is clustered in the Fabaceae family, one of the earliest and most widely consumed pulses in the sphere, and it is a core intake crop in hot and subtropical zones [1]. Chickpea is the world’s second most widely grown-up pulse crop and originated in southeastern Turkey and the border of Syria [2]. Legume crops like Desi-type be there cool-season yearly legume plants that are cultivated in hot, sub-hot, and temperate regions of the globe [3]. The Desi-type chickpea is circumscribed nearly to Central East and Southeast Asia. The Desi-type chickpea has a trivial genomic material volume that produces a commencing overthrow [4]. Current breeding cares overhead the previous 61 generations ought to be controlled towards a narrow primer of various cultivars. Desi-type chickpeas are developed through further 51 states, with above 91% of plus crop manufacture like Desi-type chickpeas originating from Asia, and India [5].
A legume crop like Desi-type is cultivated by existing agriculturalists within numerous sections of Ethiopia under rain-suckled circumstances through remaining wetness [6] reported the efficiency of chickpeas is 2.1 t/ha; however, the yield prospective of chickpeas is as high as 7 tons per hectare [7]. Desi-type chickpeas are imperative in the advancement of viable crop growing through providing a society diet, maintaining topsoil fruitfulness, delivering animal forage, plus currency a home for agriculturalists outstanding their great marketplace value [8]. Desi-type chickpea grain has 35% - 65% sugar and 5% - 6% oil [9]. Chickpea grains are consumed garden-firsthand by way of an emerald vegetal, dehydrated, sautéed, plus fumed as a nosh snack [10].
A legume crop like Desi-type has a number of uses. An efficiency of the Desi-type chickpea within the country under farmers’ conditions is close to the ground (2.69 tons per hectare), by way linked to the possible yield of the Desi-type chickpea by enhanced administration circumstances (3.5 tons per hectare) [11]. Access to inputs, low soil fertility, and biotic constraints are the major factors currently limiting Desi-type chickpea productivity in Ethiopia [12]. Chances for accumulative harvests seem to occur through growing admittance to involvement and spending in inquiry to stun the biotic restrictions [11]. Additional enquiry into weather circumstances plus cultural practices might produce possible approaches to the proliferation of forthcoming harvests of Desi-type chickpeas.
The statement of problem in Ethiopia, a number of limiting factors contribute to the low productivity of Desi-type chickpea varieties. The manufacture of Desi-type pulse crop varieties is little due to a lack of appraisal of the erraticism plus flexibility of Desi-type pulse crop cultivars from major chickpea-producing zones. Inadequate availability of good-quality seed of improved varieties is another factor for the low productivity of Desi-type chickpea varieties. In South Wollo, Desi-type chickpea varieties are genetically and morphologically diverse, but evolution under domestication and adaptability has not been fully evaluated. Shortage of improved Desi-type pulse crop cultivars properly determines the size of inherited capriciousness plus flexibility with morphological behaviors. Slight inherited inconsistency plus adaptability was a main difficulty in developing Desi-type pulse crop cultivars through wide variation to diverse agro-ecologies and resistance plus tolerance to living and non-living pressures. A serious delinquent of Desi-type pulse crop manufacture was a habit of low-yielding native Desi-type pulse crop cultivars. Improving appropriate crop varieties is one of the most important chickpea breeding program and management activities, which improves the adaptability of Desi-type chickpea varieties. Cultivar plus zone-definite Desi-type chickpea approval is solitary of the breeding objectives to increase the fabrication plus efficiency of Desi-type pulse crop varieties. A chief motive for this fissure derives from the non-accessibility of broadly malleable and quite great-yielding cultivars, particularly in Desi-type pulse crop cultivars growing parts of the South Wollo Amhara state.
The significance of the study, the identification of local varieties adapted to different locations to improve the productivity of Desi-type chickpea production, is very important. On the other hand, it is important to determine the magnitude of the relationship between yield and yield components by estimating the selection efficiency of the traits of Desi-type chickpeas. Production of high-yield varieties approaches, which have a large influence on the yield quality and quantity of Desi-type chickpea production. The information on genetic variability and adaptability of Desi-type chickpea varieties is important to use for further production and breeding programs. It is necessary to evaluate the variability and adaptation of Desi-type chickpea varieties from major chickpea-producing areas along with the released varieties to determine the magnitude of genetic variability and adaptability using morphological trait variation. Information on adaptability and association of traits is essential to use genetic variation for further chickpea improvement, particularly in the study areas and generally in Ethiopia. The present study is important for the selection of promising candidate Desi-type chickpea varieties to be used in future Desi-type chickpea production and breeding programs for similar agroecologies. Therefore, the objective of this experiment was to evaluate, identify, and recommend early-maturing, widely adaptable, and relatively high-yielding varieties at different locations with specific objectives: to evaluate the genetic adaptability of Desi-type chickpea varieties, to investigate important yield component traits of Desi-type chickpeas, and to identify promising candidate varieties to be used in future Desi-type chickpea production and breeding programs.
Description of the experimental site
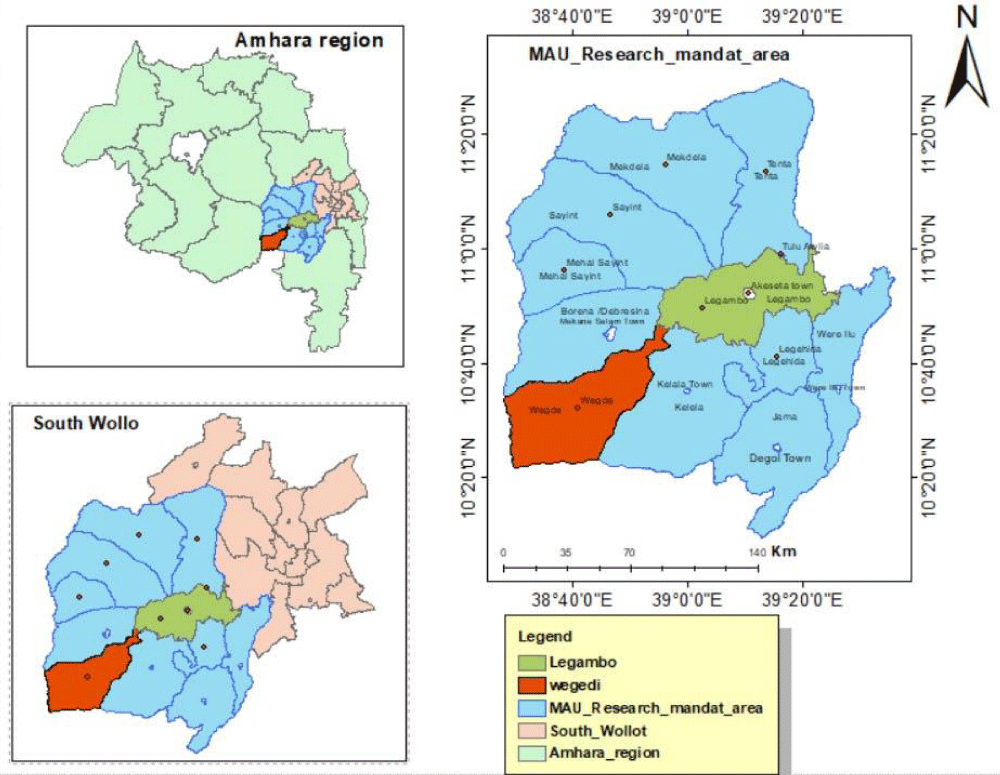
The experiments were conducted at two locations, Wegdi and Legambo Districts, under the Mekdela Amba University Research Site (Figure 1).
Wegdi
Wegdi district was one of the major Desi-type chickpea-producing areas of South Wollo, Ethiopia. The Wegdi district was located between 11°20’ N and 11°40’ N latitude and between 39°15’ E and 39°40’ E longitude in South Wollo, Ethiopia (Wegdi Agricultural Sector, 2021). Wegdi district has an altitude range of 1200 - 3200 meters above sea level (Wegdi Agricultural Sector, 2021). The rainy season in the Wegdi district was from May to September, with a mean annual rainfall of 500 - 800 mm (Wegdi Agricultural Sector, 2019).
The mean annual temperature of the Wegdi district ranges from 20 °C to 8 °C. The total area of the districts is 34,829 ha (Wegdi Agricultural Sector, 2021). The soil of the experimental sites is characterized by vertisol in the district. The land use pattern in the districts consisted of about 35% cultivated land, 6% wasteland, 15% shrub, 14% natural forest, 6% construction roads and houses, 23% natural pasture, and 1% perennial fruits (Wegdi Agricultural Sector, 2021).
Legambo
Mekdela Amba University Examination Place is found in Legambo District, similar to Wegdi District, at 9.08’N longitude and 40.08’E latitude at an altitude of 3200 meters above sea level. The Desi-type chickpea varieties were evaluated at the Legambo and Wegdi districts research sites of Mekdela Amba University, South Wollo, Ethiopia. The Legambo district was one of the major chickpea-producing areas of South Wollo, Ethiopia. The mean annual temperature of the Legambo district ranges from 18 ºC to 24 ºC. The total area of the district is 36,935 hectares (Legambo Agricultural Sector, 2021). The rainy months are from June to September. The time of sowing in the area involved was from the end of August to the middle of September (Legambo Agricultural Sector, 2021).
Experimental materials
Ten Desi-type chickpea varieties were used, and the seeds of the varieties were obtained from different research centers (Table 1).
| Table 1: Description of Desi-type chickpea test varieties. | |||||
| Varieties | Maintainer | Varieties | Maintainer | Varieties | Maintainer |
| Aqaqi | DZARC | Mestawel | DBARC | Qutaye | SRARC |
| Dalota | DZARC | Minjar | DZARC | Teketa | DZARC |
| Dimtu | DZARC | Mitk | SRARC | ||
| Fetene | SRARC | Natoli | DZARC | ||
| Source: Sirinka, Debre Birhan, and Debre Zeit Agricultural Research Center. | |||||
Experimental design
The study was constructed in a randomized complete block design with three replications at every site. This made a total of thirty experimental units for the Desi-type chickpea varieties experimental units. The size of each plot was 2 m by 3 m, and the distance between adjacent plots and replications was kept at 0.5 m and 1 m apart, respectively. The area of the experimental field covered 276 m², with 34.5 m and 8 m widths for each location. Data were collected from the central rows for most of the variables and from randomly sampled chickpea plants for some of the traits in each location. All experimental factors were applied uniformly to the entire plot except for varieties of Desi-type chickpeas in each location.
Data to be collected
Data collection was done on a plot basis and a sample plant basis. The following data were collected from the net plot: days to 50% flowering, days to 50% maturity, aboveground biomass in g per plot, grain yield in g per plot, thousand seed weight, and harvest index. The data collected from randomly selected ten plants from the three middle rows of each plot were plot:-Plant height, number of primary branches per plant, secondary branches, and pods per plant, seeds per pod, and seeds per plant.
Statistical analysis
The data was analyzed as per the design using R software (R-software, 2021). The data obtained for different traits are statistically analyzed using appropriate ways for analysis of variance and coefficient of variance, heritability, genetic advance, and correlation of traits.
Analysis of variance (ANOVA)
The analysis of variance (ANOVA) was performed using R software for the Complete Randomized Block Design (R-software, 2021). For each location and combined data over locations, analyses of variances were done using the mean of ten sample plants for all traits on a plant basis. However, plot basis was used for traits such as days to 50% flowering, days to 50% maturity, aboveground biomass, grain yield, thousand seed weight, and harvest index for analysis of variance.
Mean separation performed with DMRT at (p < 0.05) 5% level of significance.
For individuals, the analyses of variance were computed using the following mathematical model:
For combined analyses of variance were computed using the following mathematical model was used:
Estimation of phenotypic and genotypic parameters
Phenotypic and genotypic alteration parts and their constants of deviation were predicted by [13].
Genotypic variance
Phenotypic alteration on a mean basis equals
Coefficients of deviations at phenotypic and genotypic stages were expected using the method accepted by [13].
Phenotypic coefficient of variation
Genotypic Coefficient of variation
Alteration constituents for data joint locations were calculated for each location by using the methods [13].
Genotypic variance
Genotypic variance
Heritability and genetic advance
Heritability was stated as the proportion of genotypic alteration to the phenotypic alteration as designated by [13]:
Genetics advance: Estimated genetic improvement for each trait at 5% choice strength was calculated using the approach termed [13].
Genetic advance as a percent of the mean is calculated to compare the extent of predicted advance of different traits under selection, using the following formula [13].
Estimation of phenotypic and genotypic correlations
The trait relationship represented by the correlation coefficient between different pairs of traits at the genotypic and phenotypic levels is calculated from the genotypic and phenotypic covariance. Genotypic and phenotypic relationship factors among yield and yield-related traits would be evaluated by the routine as defined [13].
Phenotypic correlation coefficient =
Genotypic correlation coefficient =
The calculated absolute t-value was tested against the tabulated t-value at n - 2 degrees of freedom for both phenotypic and genotypic correlations. To compute the DMRT value at the α (1% and 5%) level of significance:
But,
Analysis of variance of studied traits
For each location (Tables 2,3) and across locations (Table 4),analysis of variance was carried out for traits recorded at Wegdi and Legambo Districts, respectively. At this point, a highly significant variance among Desi-type chickpea varieties for days to flowering and maturity, primary and secondary branches per plant, plant height, pods per plant, seeds per pod and per plant, thousand-seed weight, biomass and seed yield, and harvest index at Wegdi and Legambo Districts and across locations, respectively, shows the genomic erraticism and adaptability for yield and yield-related traits. In agreement with the present study, [14] reported observable genetic variability and adaptability for seed yield and its component traits in the studied Desi-type chickpea varieties in Ethiopia. But [4] described non-significant variances among Desi-type chickpea varieties for days to flowering and maturity, primary and secondary branches per plant, seeds per plant, thousand-seed weight, biomass, and grain yield, which contradicts the present study.
| Table 2: Nasty squares of characters of Desi-type chickpea varieties tested at Wegdi District. | ||||
Traits |
Rep.(df = 2) | Genotype(df = 9) | Error(df = 18) | CV |
| DF | 2.03 | 16.50** | 2.74 | 3.3 |
| DM | 3.43 | 38.98** | 2.66 | 1.5 |
| PB | 0.13 | 15.49** | 0.10 | 5.7 |
| SB | 0.70 | 9.69** | 0.14 | 7.0 |
| PH | 0.43 | 71.37** | 2.10 | 3.2 |
| PPl | 2.53 | 544.77** | 2.72 | 2.7 |
| SP | 0.03 | 0.48** | 0.03 | 9.3 |
| SPl | 7.23 | 2211.49** | 4.42 | 1.8 |
| HW | 0.93 | 101.36** | 0.64 | 2.8 |
| BY | 67279.00 | 4145992.00** | 51198.00 | 2.5 |
| GY | 14404.00 | 3093561.00** | 22412.00 | 4.3 |
| HI% | 0.84 | 531.28** | 4.40 | 5.4 |
| Table 3: Nasty squares of characters of Desi chickpea varieties tested at Legambo District. | ||||
Traits |
Rep.(df = 2) | Genotype(df = 9) | Error(df = 18) | CV |
| DF | 0.00 | 7.91** | 0.22 | 0.9 |
| DM | 0.30 | 24.77** | 0.26 | 0.5 |
| PB | 0.13 | 7.49** | 0.10 | 5.7 |
| SB | 0.23 | 20.36** | 0.12 | 5.6 |
| PH | 0.43 | 40.91** | 0.51 | 1.6 |
| PPl | 0.70 | 965.11** | 0.29 | 0.8 |
| SP | 0.03 | 0.70** | 0.03 | 9.0 |
| SPl | 1.23 | 3214.8** | 1.34 | 1.0 |
| HW | 0.13 | 109.73** | 0.21 | 1.6 |
| BY | 17479 | 4644332** | 23695 | 1.7 |
| GY | 19173 | 2374316** | 21445 | 4.4 |
| HI% | 2.913 | 438.78** | 4.38 | 5.5 |
| Table 4: Nasty squares of characters of Desi-type chickpea varieties tested across two locations. | |||||||
Traits |
Rep. (df = 2) |
Genotype (df = 9) |
Location (df = 1) |
Genotype.Location (df = 9) |
Error (df = 38) |
Gmean | CV |
| DF | 1.02 | 17.75** | 6.67* | 6.67** | 1.46 | 50.27 | 2.4 |
| DM | 2.22 | 60.94** | 2.82ns | 2.82ns | 1.46 | 112.1 | 1.1 |
| PB | 0.27 | 20.71** | 0.0 | 2.26** | 0.09 | 5.4 | 5.6 |
| SB | 0.47 | 20.52** | 11.27** | 9.53** | 0.15 | 5.8 | 6.7 |
| PH | 0.05 | 109.45** | 19.27** | 2.82* | 1.28 | 44.4 | 2.5 |
| PPl | 2.52 | 1416.97** | 528.07** | 92.92** | 1.46 | 63 | 1.9 |
| SP | 0.05 | 1.15** | 0.07ns | 0.13ns | 0.03 | 2 | 9.0 |
| SPl | 6.02 | 5339.02** | 453.75** | 87.27** | 2.86 | 117 | 1.4 |
| HW | 0.87 | 209.71** | 0.0 | 1.37** | 0.41 | 28.4 | 2.3 |
| BY | 68090 | 8773657** | 16667ns | 36667ns | 6353 | 8985 | 2.1 |
| GY | 32583 | 5413176** | 283181** | 54701* | 20827 | 3386 | 4.3 |
| HI% | 3.15 | 962.8** | 28.42* | 7.26ns | 4.19 | 38.5 | 5.3 |
Extremely substantial location-specific effects were perceived for all the traits apart from secondary branch and seed per pod, which showed the alterations in growth circumstances indicated through the two locations. The varieties were substantial (p ≤ 0.01) for days to flowering and maturity, primary and secondary branches per plant, plant height, pods per plant, seeds per pod and plant, thousand-seed weight, biomass, and seed yield, and harvest index across the two locations that indicated variability in studied Desi-type varieties at Wegdi and Legambo Districts. Selection was effective for different traits in crossing programs for creating variability. Location varieties collaboration was greatly significant for primary and secondary branches per plant, seed per pod and plant, thousand seed weight, biomass, and seed yield crosswise the two locations. However, days to flowering and maturity were frail, significant, and oblique at the two locations.
This significant variation showed that different performance of the Desi type chickpea varieties across the two locations and Desi type chickpea varieties responded differently to the different environmental conditions, suggesting the importance of the assessment of varieties under different environments to identify better performing Desi type chickpea varieties for the Wegdi and Legambo District environments.
Days to flowering
Analysis of variance indicated highly significant variability between Desi-type chickpea varieties for days to flowering at the Legambo location (Table 3). Early and late flowering varieties were Minjar, with a mean of 48 days, and Dalota, with a mean of 53 days, respectively (Table 5). Sixty percent (60%) of varieties had more days to flowering than the grand mean (50.6 days) to reach their 50% flowering. However, forty percent (40%) of varieties had fewer days to flowering than the grand mean (50.6) days to reach their 50% flowering stage at the Legambo location. In agreement with the present study, [15] reported a narrow variation of days to flowering, ranging from 49 to 55 days among Desi-type chickpea varieties. As presented in Table 5, Minjar and Natoli were identified as early-flowering varieties in the future breeding program of Desi-type chickpeas to combine earliness with higher seed yield at the Legambo location. Because the earliness of variety for days to flowering alone is not a desired trait without other traits like higher seed yield, for the adoption of varieties by farmers.
| Table 5: Mean performance of Desi-type chickpea varieties tested at Legambo District. | ||||||||||||
| Geno. | DF | DM | PB | SB | PH | PPI | SP | SPI | HW | BY | GY | HI% |
| Aqaqi | 50b | 112.7d | 5.7de | 3.7d | 42de | 54h | 2b | 90h | 25d | 8996cd | 2727efg | 30.3 |
| Dalota | 53g | 115.7e | 6.0cd | 8.7b | 48ab | 86b | 2b | 155b | 34b | 8945d | 4505b | 50.4 |
| Dimtu | 50bc | 111.7c | 8.0a | 10a | 48.3a | 89a | 3a | 157a | 39a | 7610f | 4797a | 63.2 |
| Fetene | 51bcd | 110.0b | 5.3ef | 3.7d | 43cd | 55g | 2b | 92g | 22f | 9874b | 2333h | 23.6 |
| Mesta | 51cde | 111.7c | 7.0b | 8.0c | 48ab | 79g | 2b | 151c | 26d | 10105b | 4134c | 40.9 |
| Minjar | 48a | 107.7a | 5.0f | 4.0d | 40.0f | 54h | 2b | 108e | 23e | 10950a | 2927e | 26.7 |
| Mitk | 52f | 116.7f | 3.0g | 7.7c | 40.7ef | 60f | 2b | 100f | 25d | 8483e | 2536gh | 29.9 |
| Natoli | 48a | 112.7d | 6.3c | 9.0b | 47.0b | 83c | 2b | 154b | 35b | 8890d | 3690d | 41.5 |
| Qutaye | 51def | 115.0e | 5.0f | 4.0d | 38.7g | 75e | 2b | 123d | 23e | 9256c | 2883ef | 31.2 |
| Teketa | 52ef | 109.3b | 3.0g | 4.0d | 43.3c | 34i | 1c | 68i | 32c | 6576g | 2647fg | 40.3 |
| Gmean | 50.6 | 112.3 | 5.4 | 6.3 | 43.8 | 66.9 | 2.3 | 120 | 28 | 8969 | 3318 | 37.8 |
| CV | 0.9 | 0.5 | 5.7 | 5.6 | 1.6 | 0.8 | 9.0 | 1.0 | 1.6 | 1.7 | 4.4 | 5.5 |
| DMRT at 5% | 0.81 | 0.81 | 0.53 | 0.6 | 1.22 | 0.93 | 0.3 | 1.99 | 0.8 | 264 | 251 | 3.59 |
The analysis of variance showed a significant difference (p > 0.01) between Desi-type chickpea varieties for days to flowering at the Wegdi location (Table 2). Desi-type chickpea varieties indicated a narrow range of days to flowering, from 45 to 53 (8) days between early and late flowering varieties. Early and late flowering varieties were Teketaye, with a mean of 45 days, and Dalota, with a mean of 53 days, respectively (Table 6). Forty percent (40%) of varieties had more days to flowering than the grand mean (50 days) to reach their flowering stage. On the other hand, sixty percent (60%) of the varieties had fewer days to flowering than the grand mean (50) days to reach their 50% flowering stage at the Wegdi location from 10 Desi-type chickpea tested varieties. In agreement with the present study, [16] reported a narrow variation of days to flowering, ranging from 47 to 53 days between chickpea varieties.
| Table 6: Mean performance of Desi-type chickpea varieties tested at Wegdi District. | ||||||||||||
| Geno. | DF | DM | PB | SB | PH | PPI | SP | SPI | HW | BY | GY | HI% |
| Aqaqi | 50bcd | 112cd | 5.7d | 4.3d | 41.7d | 54d | 2b | 90g | 25de | 8996c | 2727cd | 30.3 |
| Dalota | 53d | 115df | 8.0b | 6.0b | 49.3b | 70b | 2b | 134c | 34b | 8945c | 4883a | 54.6 |
| Dimtu | 50bcd | 111c | 9.0a | 7.7a | 52.3a | 76a | 2.7a | 141b | 38a | 7610e | 4899a | 64.5 |
| Fetene | 50bcd | 110bc | 5.3d | 4.3cd | 42.7d | 55d | 2b | 92g | 22g | 9874b | 2333e | 23.6 |
| Mesta | 51cd | 111c | 7.0c | 3.7de | 50.0b | 77a | 2b | 140b | 24ef | 10105b | 4367b | 43.2 |
| Minjar | 47ab | 107ab | 3.0e | 8.0a | 40de | 54d | 2b | 108e | 25de | 10950a | 2927c | 26.7 |
| Mitk | 52d | 116f | 3.0e | 7.7a | 40de | 60c | 2b | 100f | 26d | 8483d | 2536de | 29.9 |
| Natoli | 48bc | 112cde | 7.0c | 5.0c | 49b | 75a | 2b | 148a | 35b | 8890c | 4233b | 47.6 |
| Qutaye | 51cd | 115def | 3.0e | 3.3e | 38.7e | 54d | 2b | 123d | 23f | 9256c | 2883c | 31.2 |
| Teketa | 45a | 105a | 3.3e | 4.0de | 45.3c | 35e | 1c | 66h | 32c | 6909f | 2763cd | 40.0 |
| Gmean | 50 | 112 | 5.4 | 5.4 | 44.97 | 60.9 | 1.97 | 114 | 28.4 | 9002 | 3455 | 39.2 |
| CV | 3.3 | 1.5 | 5.7 | 7.0 | 3.2 | 2.7 | 9.3 | 3.6 | 2.8 | 2.5 | 4.3 | 5.4 |
| DMRT at 5% | 2.84 | 2.80 | 0.53 | 0.65 | 2.49 | 2.83 | 0.31 | 1.8 | 1.37 | 388.1 | 256.8 | 3.6 |
Days to maturity
The analysis of variance showed highly significant variability among the varieties for the trait days to 50% maturity at the Legambo location (Table 3). Desi-type chickpea varieties showed a narrow range of variation from 108 to 117 (9) days for days to maturity. As presented in Table 6, seventy percent (70%) of varieties matured in fewer days than the grand mean (112 days). Early and late maturing varieties were Minjar, with a mean of 108 days, and Mitk, with a mean of 118 days, respectively, at the Legambo location (Table 6). Similarly, [15] reported a narrow variation of days to maturity ranging from 112 to 115 days among chickpea varieties. The analysis of variance indicated a significant difference (p < 0.01) between the Desi-type chickpea tested varieties for the trait days to 50% maturity at the Wegdi study area (Table 6). The varieties indicated a range of variation from 105 to 116 (11) days for days to 50% maturity (Table 6).
Primary branch
The analysis of variance showed highly significant variability between the tested varieties for the number of primary branches per plant at the Wegdi location (Table 2). The number of primary branches per plant, which contributes to the number of productive branches per plant, ranged from 3 to 9, with a grand mean of 5.4 at the Wegdi study location. Varieties with the lowest and highest numbers of primary branches per plant were Minjar, Mitk, Kutaye, and Dimtu, with means of 3 and 9, respectively (Table 6). In agreement with the present study, [17] reported a variation in the primary branch number per plant, which ranged from 3 to 7 between chickpea varieties.
The analysis of variance indicated significant variability (p < 0.01) among the Desi-type chickpea varieties for the number of primary branches per plant at the Legambo location (Table 3). Similarly, with the present study, [18] reported a variation in the primary branch number per plant, which ranged from 2 to 6 between chickpea varieties. The analysis of variance indicated significant variability (p < 0.01) among the Desi-type chickpea varieties for the number of primary branches per plant across location (Table 4).
Secondary branch
Analysis of variance showed a significant difference (p < 0.01) between the varieties for secondary branches per plant at Wegdi, Legambo, and across locations (Tables 2, 3, and 4). The varieties with the lowest and highest numbers of secondary branches per plant at the Wegdi and Legambo locations were indicated (Tables 5,6). In agreement with the present study, [19] reported a variation in secondary branches per plant ranging from 3 to 9 between kabuli chickpea varieties. The Dimtu variety was found to be a high grain yielder with a higher number of secondary branches per plant, which makes them desirable as they combine with the seed yield of important traits at Wegdi, Legambo Districts, and related locations. Because high numbers of secondary branches per plant are a desired trait to increase seed yield of chickpea varieties, it is important for the easier adoption of varieties by farmers.
Plant height
Analysis of variance showed significant variability (p < 0.01) between varieties for plant height at Wegdi, Legambo, and across the two locations (Tables 2-4). The magnitude of variation for plant height ranged from 38.7 to 52.3 cm with a grand mean height of 44.97 cm at the Wegdi location (Table 6).
As presented in Table 5, the shortest and longest plant height varieties were Qutaye, with a mean of 38.7 cm, and Dimtu, with a mean of 48.3 cm, respectively, at the Legambo location in the present study. The performance of Desi-type chickpea varieties tested at Wegdi and Legambo locations is indicated (Tables 5,6).
Pod per plant
The analysis of variance showed a highly significant difference among the varieties for the trait pods per plant at the Legambo location (Table 3). The magnitude of variation for pods per plant ranged from 34 to 89, with a grand mean of 66.9. The varieties with the lowest and highest numbers of pods per plant were Teketaye, with a mean of 34, and Dimtu, with a mean of 89, respectively. Fifty percent (50%) of the varieties had a lower number of pods per plant than the grand mean of 66.9, and the rest of the varieties had a higher number of pods per plant than the grand mean of 66.9 from the evaluated chickpea varieties. In disagreement with the present study, [7] reported a variation in the number of pods per plant, which ranged from 28 to 39 among chickpea varieties. [20] Reported a wide variation in the number of pods per plant, which ranged from 30 to 62 among chickpea varieties. Dimtu varieties were found to be high seed yielders and had a high number of pods per plant, which makes them desirable as they combined higher seed-yielding Desi-type chickpea varieties at Legambo and related locations in the present study.
The analysis of variance indicated significant variability (p < 0.01) between Desi-type chickpea varieties for the trait pod per plant at the Wegdi location (Table 2). The magnitude of variation for pods per plant ranged from 35 to 76, with a grand mean of 60.9. The varieties with the highest and lowest numbers of pods per plant were Natoli, with a mean of 75, and Teketaye, with a mean of 35, respectively (Table 6).
Seed yield
The analysis of variance showed significant variation (p < 0.01) between Desi-type chickpea varieties for seed yield at the Legambo location study area (Table 3). The presence of highly significant variation indicated the existence of considerable genetic variation between the tested Desi-type chickpea varieties in the study area. In addition, the seed yield of Desi-type chickpea varieties ranged from 2333 to 4797 kg. The tested Desi-type chickpea varieties with the lowest and highest seed yields were Fetenech, with a mean of 2333 kg, and Dimtu, with a mean of 4797 kg, respectively (Table 5). In harmony with present findings, [21] reported a wide variation in seed yield per hectare, which ranged from 2515 kg to 4355 kg among Desi-type chickpea varieties at the Legambo study area. The top four Desi-type chickpea varieties identified for high seed yield were higher for the ground biomass, which makes them desirable as they combined yield components of seed yield at the same Desi-type chickpea varieties at the study area (Table 5). The analysis of variance showed highly significant variation among Desi-type chickpea varieties for seed yield at the Wegdi location (Table 6).
Variance components and coefficients of variation
At the Legambo study location, phenotypic variance ranged from 0.25 for the number of seeds per pod to 1563907 for biomass yield (Table 7). The magnitudes for genotypic variances ranged between 0.22 for the number of seeds per pod and 1540212 for biomass yield at Legambo location (Table 7). The difference between genotypic and phenotypic variance was very small in magnitude. This indicated that the variation among varieties was due to genetic effect, whereas the effect of environment was very small in the study area. This indicates that the genotype of varieties could be reflected by the phenotype and effectiveness of selection based on the phenotypic performance for these traits. These traits showed smaller genotypic variability. The finding is in agreement with [17] for days to 50% flowering, days to 50% maturity, number of seeds per plant, biomass yield per plot, seed yield, and plant height.
| Table 7: Phenotypic and genotypic variance, heritability, and genetic advance for traits Desi type chickpea varieties at Legambo District. | ||||||||
| Traits | PCV | GCV | H2 | GA | GAM | |||
| DF | 2.78 | 2.56 | 0.22 | 3.30 | 3.16 | 92.09 | 3.16 | 6.24 |
| DM | 8.43 | 8.17 | 0.26 | 2.59 | 2.55 | 96.92 | 7.79 | 5.15 |
| PB | 2.56 | 2.46 | 0.1 | 29.63 | 29.05 | 96.09 | 3.16 | 58.54 |
| SB | 6.87 | 6.75 | 0.12 | 41.6 | 41.24 | 98.25 | 5.29 | 84.04 |
| PH | 13.98 | 13.47 | 0.51 | 8.54 | 8.38 | 96.35 | 7.40 | 16.89 |
| PPl | 321.89 | 321.6 | 0.29 | 26.82 | 26.81 | 99.91 | 36.85 | 55.09 |
| SP | 0.25 | 0.22 | 0.03 | 24.63 | 23.11 | 88.20 | 9.05 | 1.48 |
| SPl | 1072.49 | 1071.15 | 1.34 | 27.29 | 27.27 | 99.88 | 67.25 | 56.04 |
| HW | 36.72 | 36.51 | 0.21 | 21.34 | 21.28 | 99.43 | 12.39 | 43.62 |
| BY | 1563907 | 1540212 | 23695 | 37.69 | 37.40 | 98.48 | 2532.1 | 76.31 |
| GY | 805735 | 784290 | 21445 | 897.6 | 885.6 | 97.30 | 1795.7 | 54.12 |
| HI% | 149.18 | 144.8 | 4.38 | 32.31 | 31.83 | 97.06 | 24.35 | 64.44 |
At the Wegdi study area, the magnitudes for genotypic variances ranged between 0.15 for the number of seeds per pod and 1364931 for biomass yield (Table 8). The phenotypic variance also ranged from 0.18 for the number of seeds per pod to 1416129 for biomass yield (Table 8). The difference between genotypic and phenotypic variance was very small in magnitude, similar to the Legambo experimental site. This indicated that the variation between Desi-type chickpea varieties was due to genetic effects. However, the effect of the environment was very small at both study areas. In harmony with this study [21] for the number of primary and secondary branches per plant, seed yield and plant height, seeds per pod, days to maturity, seeds per plant, biomass yield per plot, seed yield, and plant height.
| Table 8: Phenotypic and genotypic variance, heritability, and genetic advance for traits Desi type chickpea at Wegdi District. | ||||||||
| Traits | PCV | GCV | H2 | GA | GAM | |||
| DF | 7.33 | 4.59 | 2.74 | 5.4 | 4.28 | 92.62 | 3.49 | 6.97 |
| DM | 14.77 | 12.11 | 2.66 | 3.43 | 3.11 | 81.99 | 6.48 | 5.78 |
| PB | 5.23 | 5.13 | 0.1 | 42.35 | 41.94 | 98.1 | 4.61 | 58.42 |
| SB | 3.32 | 3.18 | 0.14 | 33.74 | 33.02 | 95.78 | 3.59 | 66.45 |
| PH | 25.19 | 23.09 | 2.1 | 11.16 | 10.69 | 91.66 | 9.46 | 21.03 |
| PPl | 183.4 | 180.68 | 2.72 | 22.24 | 22.07 | 98.52 | 27.43 | 45.04 |
| SP | 0.18 | 0.15 | 0.03 | 21.54 | 19.66 | 83.33 | 0.73 | 0.37 |
| SPl | 740.11 | 735.69 | 4.42 | 23.86 | 23.79 | 99.40 | 55.6 | 48.77 |
| HW | 34.21 | 33.57 | 0.64 | 20.59 | 20.4 | 98.13 | 11.8 | 41.55 |
| BY | 1416129 | 1364931 | 51198 | 13.23 | 12.98 | 96.38 | 2358 | 26.2 |
| GY | 1046128 | 1023716 | 22412 | 29.6 | 29.28 | 97.86 | 2057.9 | 59.56 |
| HI% | 180.03 | 175.63 | 4.4 | 34.23 | 33.81 | 97.56 | 26.91 | 68.66 |
Across location variety by environment (location) interaction variance ranged from 0.03 for number of seeds per pod to 11291 for biomass yield (Table 9). Across locations, phenotypic variance ranged from 1.81 for the number of seeds per pod to 1456345 for biomass yield (Table 9). Across locations, the magnitudes for genotypic variances ranged from 1.47 for the number of seeds per pod to 1456165 for biomass yield, similar to the individual study location.
| Table 9: Phenotypic and genotypic variance, heritability, and genetic advance for traits Desi type chickpea varieties tested across the two locations. | |||||||||
| Traits | PCV | GCV | H2 | GA | GAM | ||||
| DF | 1.74 | 4.38 | 1.85 | 1.46 | 4.16 | 2.71 | 95.2 | 1.82 | 3.6 |
| DM | 0.45 | 11.57 | 9.69 | 1.46 | 3.03 | 2.78 | 83.75 | 5.86 | 5.23 |
| PB | 0.72 | 4.25 | 3.1 | 0.09 | 38.2 | 32.6 | 72.94 | 3.09 | 57.25 |
| SB | 3.13 | 3.99 | 1.83 | 0.15 | 34.4 | 23.32 | 85.86 | 1.88 | 32.47 |
| PH | 0.51 | 19.61 | 17.77 | 1.28 | 9.97 | 9.49 | 90.66 | 8.25 | 10.59 |
| PPl | 30.49 | 227.4 | 220.68 | 1.46 | 23.94 | 23.58 | 97.04 | 30.1 | 47.78 |
| SP | 0.03 | 1.81 | 1.47 | 0.03 | 0.67 | 0.61 | 81.2 | 1.82 | 0.91 |
| SPl | 18.14 | 881.3 | 875.3 | 2.86 | 25.37 | 25.29 | 99.32 | 60.62 | 10.1 |
| HW | 0.32 | 35.93 | 34.72 | 0.41 | 21.12 | 20.75 | 96.6 | 11.9 | 41.92 |
| BY | 10104 | 1456345 | 1456165 | 6353 | 1206 | 1205 | 86.2 | 1238 | 75.3 |
| GY | 11291 | 893329 | 893079 | 20827 | 27.9 | 27.4 | 68.9 | 1941 | 57.3 |
| HI% | 1.02 | 160 | 159 | 4.19 | 32.8 | 32.7 | 99.4 | 25.75 | 66.9 |
The considerations of phenotypic constant of deviation in this study were greater than those.Consistent genomic constant of deviation showing the effect of location on the appearances for days to 50% flowering, days to 50% maturity, number of primary and secondary branches per plant, biomass, seed yield, harvest index, plant height, pods per plant, seed per pod, and plant, and thousand seed weight. However, the differences were small at both locations, which are the Legambo and Wegdi experimental sites.
Correlation of yield with yield-related traits
Grain yield is a composite characteristic that is disturbed by the influence of various traits. Therefore, understanding the inheritance and relationship of seed yield and yield component traits influencing these traits is very important for formulating selection criteria. The estimation of the magnitudes of genotypic and phenotypic correlations of seed yield and its components between yield-related traits is highly crucial to utilize existing variability through selection. At phenotypic glassy, grain yield was positively and expressively associated with plant height, pods per plant, primary and secondary branches per plant, and seeds per pod and plant (Table 10). The outcomes are in harmony with [22] described for the relationship of grain yield with harvest index, secondary branches, plant height, pods per plant, and seeds per pod in harmony with this finding.
| Table 10: Genotypic (above diagonal) and phenotypic (below diagonal) correlation coefficients of the traits of Desi-type chickpea at Wegdi District. | ||||||||||||
| Trait | DF | DM | PB | SB | PH | PPl | SP | SPl | HW | BY | GY | HI% |
| DF | 1 | 0.87** | -0.68* | 0.54ns | 0.37ns | 0.13ns | 0-.64* | -0.31ns | 0.52ns | -0.87** | 0.75* | 0.89** |
| DM | 0.58** | 1 | -0.34ns | 0.53ns | 0.21ns | 0.87** | 0.54ns | 0.76* | -0.65* | 0.76* | 0.75* | 0.64* |
| PB | -0.26ns | 0.06ns | 1 | 0.87** | 0.93** | 0.96** | 0.97** | 0.94** | 0.87** | 0.83** | 0.93** | 0.78* |
| SB | 0.13ns | 0.41** | 0.53** | 1 | 0.94** | 0.97** | 0.88** | 0.82** | -0.74* | 0.92** | 0.86** | 0.89** |
| PH | 0.11ns | 0.04ns | 0.66** | 0.77** | 1 | 0.76* | 0.45* | 0.94** | 0.79** | -0.92** | 0.97** | 0.86** |
| PPl | 0.05ns | 0.47** | 0.76** | 0.79** | 0.61** | 1 | 0.76* | 0.98** | 0.78** | 0.93** | 0.76* | 0.83** |
| SP | -0.29ns | 0.07ns | 0.67** | 0.44** | 0.23ns | 0.61** | 1 | 0.76* | 0.32ns | 0.42ns | 0.86** | 0.89** |
| SPl | -0.05ns | 0.32** | 0.78** | 0.81** | 0.69** | 0.97** | 0.57** | 1 | 0.87** | 0.45ns | 0.98** | 0.87** |
| HW | 0.07ns | 0.12ns | 0.42** | 0.72** | 0.74** | 0.49** | 0.12ns | 0.54** | 1 | -0.87** | 0.86** | 0.84** |
| BY | 0.41** | 0.17ns | 0.23ns | 0.21ns | 0.23ns | 0.15ns | 0.3ns | 0.18ns | 0.62** | 1 | -0.87** | -0.86** |
| GY | 0.09ns | 0.17ns | 0.77** | 0.81** | 0.82** | 0.82** | 0.48** | 0.88** | 0.74** | -0.09ns | 1 | 0.94** |
| HI% | 0.21ns | 0.15ns | 0.58** | 0.76** | 0.79** | 0.62** | 0.34* | 0.66** | 0.91** | 0.52** | 0.89** | 1 |
At the genotypic level, seed yield showed a strong and positive significant correlation with different traits in the Wegdi study area (Table 10). Accordingly, enrichment of traits would result sizable rise in grain yield. At the genomic proximate, grain yield was tough and optimistically expressively correlated with primary and secondary branches per plant, plant height, pods per plant, seeds per pod and plant, thousand-seed weight, and harvest index (Table 10). This positive genomic relationship with seed yield was in harmony with a previous report [14]. Similarly, at the phenotypic and genotypic levels, seed yield showed different significant correlation natures with different traits at the Legambo study area (Table 11). Therefore, improvement of these traits would result in a substantial increase in the seed yield of Desi-type chickpea varieties [23].
| Table 11: Genotypic (above diagonal) and phenotypic(below diagonal) correlation coefficients of traits of Desi-type chickpeas at Legambo District. | ||||||||||||
| Trait | DF | DM | PB | SB | PH | PPl | SP | SPl | HW | BY | GY | HI% |
| DF | 1 | 0.87** | 0.64* | 0.43* | 0.63* | 0.78** | 0.84** | 0.62* | -0.24ns | 0.73* | 0.76* | 0.93** |
| DM | 0.79** | 1 | 0.23ns | 0.76* | 0.26ns | 0.67* | 0.63* | 0.87** | 0.65* | 0.84** | 0.65* | 0.87** |
| PB | 0.3ns | 0.18ns | 1 | 0.12ns | 0.98** | 0.74* | 0.78** | 0.43* | 0.76* | 0.94** | 0.48* | 9.4** |
| SB | 0.07ns | 0.10ns | 0.07ns | 1 | 0.21ns | 0.38ns | 0.91** | 0.76* | 0.37ns | 0.87** | 0.84** | 0.76* |
| PH | -0.2ns | -0.1ns | 0.87** | 0.06ns | 1 | 0.96** | 0.87** | 0.48* | 0.87** | -0.89** | 0.86** | 0.94** |
| PPl | 0.44* | 0.45* | 0.77* | 0.23* | 0.67* | 1 | 0.65* | 0.98** | 0.78** | 0.79** | 0.56* | 0.82** |
| SP | 0.50* | 0.44* | 0.51* | 0.39* | 0.24* | 0.63* | 1 | 0.76* | 0.92** | 0.54* | 0.59* | 0.65* |
| SPl | 0.41* | 0.47* | 0.65* | 0.14ns | 0.56* | 0.91** | 0.63* | 1 | 0.86** | 0.45* | 0.68* | 0.78** |
| HW | 0.1ns | 0.02ns | 0.58* | 0.33ns | 0.69* | 0.33** | 0.12ns | 0.38** | 1 | -0.89** | 0.87** | 0.65* |
| BY | 0.16ns | 0.03ns | 0.13ns | 0.01ns | -0.2ns | 0.21ns | 0.24* | 0.22* | -0.65* | 1 | 0.76* | 0.84** |
| GY | 0.20ns | 0.20ns | 0.85** | 0.15ns | 0.86** | 0.8** | 0.42* | 0.81** | 0.69* | -0.12 | 1 | 0.58* |
| HI% | 0.09ns | 0.12ns | 0.8** | 0.2ns | 0.87** | 0.6* | 0.32* | 0.62** | 0.87** | -0.49* | 0.92** | 1 |
In the present study, results obtained from erraticism evaluation, association between yield and yield-related component traits, coefficient of variance, heritability, and genetic advance under selection of traits were recorded at individual locations and across locations. The investigation of variance indicated extremely significant variation among Desi-type chickpea varieties for all traits at Wegdi and Legambo Districts (Tables 2,3). The result indicated the presence of genetic variability and adaptability in yield and its component traits between Desi-type chickpea varieties at both study areas. Small coefficients of variation were used to compare the precision of experimental results at the study location. Means with lower coefficients of variation for most traits revealed the existence of reliability of data in the study area. The mean of seed yield was Aqaqi with a mean of 2727 and 2727 kg, Dalota with a mean of 4505 and 4883 kg, Dimtu with a mean of 4797 and 4899 kg, Fetenech with a mean of 2333 and 2333 kg, Mestawel with a mean of 4134 and 4367 kg, Minjar with a mean of 2927 and 2927 kg, Mitk with a mean of 2536 and 2536 kg, Natoli with a mean of 3690 and 4233 kg, Kutaye with a mean of 2883 and 2883 kg, and Teketai with a mean of 2647 and 2763 kg. Desi-type chickpea varieties were recorded in the present study. From tested varieties, Dalota with a mean of 4505 and 4883 kg, Dimtu with a mean of 4797 and 4899 kg, Mestawel with a mean of 4134 and 4367 kg, and Natoli with a mean of 3690 and 4233 kg, Desi-type chickpea varieties were the top four potential and better-performing materials to distribute for farmers’ further adoption and breeding programs for various purposes at both Wegdi and Legambo Districts, respectively (Tables 5,6).
The PCV values were slightly greater than GCV values in individuals and across study locations, although the differences were very small. This indicated that the environmental effect was very small for the expression of all traits in the individual and across study locations. Broad-sense heritability ranged from 68.2% to 99.91% in individuals and across study locations. These results indicated the possibility of progress from selection mainly under genetic control and less influenced by observed environmental variations, except for some traits across locations.
Generally, the present study of the individual and across study locations revealed the existence of significant genetic variability and adaptability between the tested Desi-type chickpea varieties for different traits helpful for direct and indirect selection. This study recommended that the potential Desi chickpea varieties Dalota, Dimtu, Mestawel, and Natoli could be used for Desi-type chickpea variety adoption and breeding programs for yield and yield component traits improvement under the study location and similar agro-ecologies. Because the top four identified Desi chickpea varieties were found to have higher seed yield with other important yield components of seed yield in the present study. The top four potential Desi chickpea varieties should be multiplied for the future in different farmers’ locations for yield and yield component traits improvement under different agro-ecologies. Farmers, researchers, private organizations, and governmental sectors could be beneficiaries of this finding.
Availability of data and materials
The data supporting the findings of this study are available from the corresponding author upon reasonable request.
Funding information
This research was supported in part by Mekdela Amba University to conduct the study on Desi chickpea varieties. In addition to acknowledging the grant in your publication, the Journal of Plant Science and Phytopathology Public Access Policy requires all peer-reviewed journal articles supported by the Journal of Plant Science and Phytopathology to be deposited in the digital archive Journal of Plant Science and Phytopathology upon acceptance for publication.
We would like to thank all the people who contributed in some way to the work described in this study. First and foremost, we thank Dr. Fikru Mekonnen for his unreserved guidance, comments, and encouragement during the entire work of the study. We also extend our thanks to Mekdela Amba University for its invitation to propose.
- Asnake F, Dagnachew B. Chickpea breeding and crop improvement in Ethiopia: past, present, and the future. Univ J Agric Res. 2020;8(2):33–40. Available from: https://www.hrpub.org/journals/article_info.php?aid=8860
- Sfayhi D, Kharrat M. Physicochemical and cooking characteristics of Tunisian chickpea varieties. 2011. Available from: https://www.academia.edu/24867409/Physicochemical_and_Cooking_Characteristics_of_Tunisian_Chickpea_Varieties
- Kumar A, Kumar N, Kumar S. Evaluation of chickpea (Cicer arietinum L.) genotypes through phenological traits under different sowing dates. Int J Pure App Biosci. 2019;7:221–225. Available from: https://www.ijpab.com/form/2019%20Volume%207,%20issue%206/IJPAB-2019-7-6-221-225.pdf
- Shumi D, Alemayehu D, Afeta T. Adaptation study of improved chickpea (Cicer arietinum L.) varieties at mid and highland of Guji zone, Southern Ethiopia. Acad Res J Agric Sci Res. 2018;6(January):42–46. Available from: https://www.academicresearchjournals.org/ARJASR/PDF/2018/January/Shumi%20et%20al.pdf
- McKenzie BA, Hill GD. Growth and yield of two chickpea (Cicer arietinum L.) varieties in Canterbury, New Zealand. N Z J Crop Hortic Sci. 2010;38(1):67–71. Available from: https://doi.org/10.1080/01140671.1995.9513925
- Central Statistical Agency (CSA). Agricultural Sample Survey (2018), Report on area and production for major crops (private peasant holdings, main season). Addis Ababa, Ethiopia: CSA; 2019. Available from: https://www.sciepub.com/reference/339908
- Gaur PM, Tripathi S, Gowda CLL, Ranga Rao GV, Sharma HC, Pande S, et al. Chickpea seed production manual. Patancheru, India: International Crops Research Institute for the Semi-Arid Tropics (ICRISAT); 2010;28p. Available from: https://tropicallegumeshub.com/wp-content/uploads/2020/07/ChickpeaManual_full.pdf
- Anbazhagan K, Bhatnagar-Mathur P, Vadez V, Dumbala SR, Kishor PBK, Sharma KK. DREB1A overexpression in transgenic chickpea alters key traits influencing plant water budget across water regimes. Plant Cell Rep. 2015;34:199–210. Available from: https://doi.org/10.1007/s00299-014-1699-z
- Walia MK, Mohammed YA, Franck WL, Chen C. Evaluation of early seedling development of chickpea and its relation to seed yield. Agrosyst Geosci Environ. 2020;1–9. Available from: https://doi.org/10.1002/agg2.20005
- Tariku A. Evaluation and adaptability study of desi type chickpea (Cicer arietinum L.) varieties at Hirna districts of West Harerghe zone, Eastern Ethiopia. J Agric Res Adv. 2021;3(1):34–36. Available from: https://jara.org.in/uploads/archivepdf/6714JARA_Vol_03_March_2021_05.pdf
- Watson A, Ghosh S, Williams MJ, Cuddy WS, Simmonds J, Rey MD, et al. Speed breeding is a powerful tool to accelerate crop research and breeding. Nat Plants. 2018;4:23–29. Available from: https://pubmed.ncbi.nlm.nih.gov/?term=Williams+MJ&cauthor_id=29292376
- Muruiki R, Kimurto P, Vandez V, Gangarao R, Silim S, Siambi M. Effect of drought stress on yield performance of parental chickpea genotypes in semi-arid tropics. Am J Agric Biol Sci. 2018;12:159–168. Available from: http://dx.doi.org/10.17265/1934-7391/2018.03.006
- Johnson PL, Sharma RN, Nanda HC. Genetic diversity and association analysis for yield traits of chickpea (Cicer arietinum L.) under rice-based cropping system. Bioscan. 2015;10(2):879–884. Available from: https://thebioscan.com/index.php/pub/article/view/1624?articlesBySimilarityPage=3
- Kudapa H, Garg V, Chitikineni A, Varshney RK. The RNA-Seq-based high-resolution gene expression atlas of chickpea (Cicer arietinum L.) reveals dynamic spatiotemporal changes associated with growth and development. Plant Cell Environ. 2018;41:2209–2225. Available from: https://doi.org/10.1111/pce.13210
- Chen Y, Ghanem ME, Siddique KHM. Characterising root trait variability in chickpea (Cicer arietinum L.) germplasm. J Exp Bot. 2017;68:1987–1999. Available from: https://doi.org/10.1093/jxb/erw368
- Archak S, Tyagi RK, Harer PN, Mahase LB, Singh N, Dahiya OP, et al. Characterization of chickpea germplasm conserved in the Indian National Gene Bank and development of a core set using qualitative and quantitative trait data. Crop J. 2016;4:417–424. Available from: https://doi.org/10.1016/j.cj.2016.06.013
- Maheri-sis N, Chamani M, Sadeghi A, Aghazadeh AM. Nutritional evaluation of kabuli and desi type chickpeas (Cicer arietinum L.) for ruminants using the in vitro gas production technique. Int J Curr Microbiol App Sci. 2018;7(16):2946–2951. Available from: https://www.researchgate.net/publication/239925904_Nutritional_evaluation_of_kabuli_and_desi_type_chickpeas_Cicer_arietinum_L_for_ruminants_using_in_vitro_gas_production_technique
- Kiros W, Atsede T. Response of chickpea (Cicer arietinum L.) to Rhizobium inoculation and blended fertilizer rates in Laelay Maichew, central zone of Tigray, northern Ethiopia. Agric Sci. 2020;2:124–128. Available from: https://www.researchgate.net/publication/343586264_Response_of_Chickpea_Cicier_Arietinium_L_to_Rhizobium_Inoculation_and_Blended_fertilizer_Rates_in_Laelay_Maichew_Central_Zone_of_Tigray_Northern_Ethiopia
- Kumawat S, Babbar A, Biswal M, Banjarey P. Morphological characterization of elite kabuli chickpea lines. Int J Curr Microbiol App Sci. 2020;9(9):1241–1250. Available from: https://doi.org/10.20546/ijcmas.2020.909.152
- Daba K, Warkentin TD, Bueckert R, Todd CD, Tar’an B. Determination of photoperiod-sensitive phase in chickpea (Cicer arietinum L.). Front Plant Sci. 2016;7:478. Available from: https://doi.org/10.3389/fpls.2016.00478
- Kalve S, Tadege M. A comprehensive technique for artificial hybridization in chickpea (Cicer arietinum). Plant Methods. 2017;13:52. Available from: https://doi.org/10.1186/s13007-017-0202-6
- Gupta S, Nawaz K, Parween S, Roy R, Sahu K, Kumar Pole A, et al. Draft genome sequence of Cicer reticulatum L., the wild progenitor of chickpea, provides a resource for agronomic trait improvement. DNA Res. 2017;24:1–10. Available from: https://doi.org/10.1093/dnares/dsw042
- Purushothaman R, Upadhyaya HD, Gaur PM, Gowda CLL, Krishnamurthy L. Kabuli and desi chickpeas differ in their requirement for reproductive duration. Field Crops Res. 2014;163:24–31. Available from: https://doi.org/10.1016/j.fcr.2014.04.006