
More Information
Submitted: May 28, 2022 | Approved: June 16, 2022 | Published: June 20, 2022
How to cite this article: Mekonnen TB. Synthesis and characterization of CdS/CeO2 Nanocomposite with improved visible-light photocatalytic degradation of methyl orange dye. J Plant Sci Phytopathol. 2022; 6: 065-074.
DOI: 10.29328/journal.jpsp.1001077
Copyright License: © 2022 Mekonnen TB. This is an open access article distributed under the Creative Commons Attribution License, which permits unrestricted use, distribution, and reproduction in any medium, provided the original work is properly cited.
Keywords: Nanotechnology; Degradation; Photocatalysts; AOPs; Nanoparticle

Synthesis and characterization of CdS/CeO2 Nanocomposite with improved visible-light photocatalytic degradation of methyl orange dye
Tigabu Bekele Mekonnen*
Lecturer, Department of Chemistry, Mekdela Amba University, Tuluawuliya, Ethiopia
*Address for Correspondence: Tigabu Bekele Mekonnen, Lecturer, Department of Chemistry, Mekdela Amba University, Tuluawuliya, Ethiopia, Email: [email protected]
Different types of photocatalysts in single and binary systems in different molar ratios were synthesized by the co-precipitation method. Crystal structure, surface area, morphology, bandgap energy, functional groups, and optical properties of the as-synthesized photocatalysts were characterized by using XRD, BET, SEM-EDX, UV/Vis, FTIR, and PL instruments, respectively. Photocatalytic activities of the single and binary composite were evaluated by using an aqueous solution of model pollutant MeO. Photocatalytic activities of binary CdS/CeO2 (1:1) nanocomposite were found to be higher than those of single counterparts. The degradation efficiencies of the binary system were found to be 53.73%. The reusability of the binary photocatalyst was tested and only about 33% decrement was observed after four successive runs. The degradation of MeO dye follows the pseudo-first-order kinetics for the entire as-synthesized nanocomposite. The results also suggest that in the CdS/CeO2 (1:1) composite the photoinduced electrons and holes can be effectively separated.
Nature is contaminated by especially wastewater effluents of industrial manufacturing companies that contain toxic organic compounds [1]. Dyes are a well-known source of environmental pollution and therefore their removal from wastewater receives increasing attention. They are generally resistant to light, water, oxidizing agents, and many chemicals and therefore difficult to degrade once released into the aquatic systems. Azo dyes are the largest and most versatile class of organic dyestuff. These contain one or more azo bonds (–N = N–) as a chromophore group in association with aromatic structures containing functional groups such as –OH and –SO3H. The complex aromatic structures of azo dyes make them more stable and more difficult to remove from the effluents discharged into the water bodies [2]. Several physical, chemical, and biological techniques had been reported for the treatment of all types of dyes with limited success.
Recently, many processes have been extensively applied for the treatment of dye-containing wastewater such as incineration, biological treatment, ozonation, and adsorption in the solid phase. However, these procedures have their limitations. This is why the most advanced technology which is called advanced oxidation processes (AOPs) have been developed during the last decade since they can deal with the problem of dye destruction in aqueous systems.
AOPs were based on the generation of very reactive species such as hydroxyl radicals (•OH) that oxidize a broad range of pollutants quickly and non-selectively [3]. AOPs such as plasma oxidation, ozonation, Fenton, photo-Fenton catalytic reactions H2O2/UV processes, and semiconductor-mediated photocatalysis have been studied under a broad range of experimental conditions in order to reduce the color and organic load of dye-containing effluent waste waters [4,5].
The most important among those advanced oxidation processes is called heterogeneous photocatalytic oxidation which is often referred to as photocatalysis. This method deals with the oxidation mostly of organic molecules and compounds by means of a solid metal-oxide semiconductor as a catalyst, which is activated by the incidence of radiation of an appropriate wavelength. It can take place both in the aqueous phase as well as in the gas phase. Among AOPs, heterogeneous photocatalysis appears as the most emerging destructive technology. Chemical treatment of wastewaters by AOPs can result in the complete mineralization of the pollutants to simple harmless end products such as carbon dioxide, water, and inorganic salts. Ideally, a semiconductor photocatalyst for the purification of water should be chemically and biologically inert, photocatalytic active, easy to produce and use, and activated by UV or sunlight [6].
Synthetic photocatalysts show advantages such as enhanced photostability and selectivity [7,8]. The efficiency of this technique for the abatement of dyes and other organic chemicals could be attributed to the fact that the photocatalytic materials employed are non-toxic, relatively inexpensive, have a high surface area, and have broad absorption spectra ranging from ultraviolet to visible region [9]. However, photocatalytic technology is only at the laboratory stage, and there is still a long journey to apply this technology in practice [10].
Semiconductor-based photocatalysis is a promising avenue to solve the worldwide energy shortage and environmental pollution using abundant solar light [11]. Of the well-known photocatalysts, cerium dioxide (CeO2), a fascinating rare earth material, has attracted much attention owing to its high activity, low cost, and environmentally friendly properties [12]. It shows promising photoactivity for the degradation of organic pollutants and water splitting for hydrogen generation. Nevertheless, pristine CeO2 can only be excited by ultraviolet light (UV) because of its wide bandgap (about 3.2 eV), limiting its further application in the visible light region. To highly utilize solar energy, various methods, such as doping, noble metal deposition, and forming composites have been designed to enhance the absorption of CeO2 photocatalysts in the visible light region. Among them, the most effective strategy is the coupling of two semiconductors, CeO2, and another semiconductor, to form a composite [13].
There are many reports available on mixed metal oxides of CeO2 to improve its thermal stability and increase its photocatalytic performance [14]. Nanocomposites such as TiO2-CeO2 [15], CeO2-ZnO [16], ZrO2-CeO2 [17] and Ag3PO4/CeO2 [18] have been prepared and their photocatalytic activities under visible irradiation investigated.
However, the previously prepared binary photocatalysts, have moderate photocatalytic activity under visible-light illumination. Several attempts have been made to improve the degradation efficiency and recyclability of the binary photocatalysts. But in this work, the photocatalysts expanded the absorption range further in the visible region, and promoted the effective separation of photo-excited electron-hole pairs; thereby enhancing the photocatalytic efficiency. In this research, we hypothesized a good photocatalytic activity as the result of binary CdS/CeO2 n-n heterostructured nanocomposite. CdS could be able to form “A-type” heterojunction with CeO2 given the more negative potential expected to be effective in exploiting both e- and h+ in the redox process [19]. In this work, the principal objective is to synthesize binary CdS/CeO2 and evaluates the photocatalytic activity of the as-synthesized nanocomposite for the degradation of model pollutant dye, Methyl orange (MeO).
Experimental
Chemicals: Cerium nitrate hexahydrate Ce(NO3)3.6H2O and ammonia solution (25% Loba chemicals Ltd, India), cadmium acetate tetrahydrate (Cd(CH3COO)2.4H2O), and di-sodium sulfide (Na2S.9H2O) were used as the precursors of CeO2, and CdS, respectively. All chemicals were analytical grade and are bought from Sigma Aldrich.
Synthesis of photocatalysts
Synthesis of CeO2 nanoparticle: Cerium oxide nanoparticle was prepared by precipitation method [20]. An aqueous solution of 0.1 M of cerium nitrate hexahydrate Ce(NO3)3.6H2O in deionized water was prepared and stirred for 30 min. The clear solution was precipitated by dropwise addition of aqueous NH4OH solution with continuous stirring until precipitation gets completed. The stirring was continued for another 2 h and the reaction condition was then maintained at pH = 8. The reaction mixture was then stirred for 12 h to complete the precipitation process. Ash color solution changed into yellow solution after an hour of stirring time. The mixture was aged for 12 h. The resulting yellow-colored slurry was decanted, filtered, and washed several times with deionized water and ethanol. The precipitate was oven-dried at 140 ℃ for 12 h and calcined at 500 ℃ for 3 h to promote crystallization [21].
Synthesis of CdS nanoparticle: In this study, we have used cadmium acetate tetrahydrate (Cd(CH3COO)2.4H2O) as a Cd+2 ion source and di-sodium sulfide nanohydrate (Na2S.9H2O) as S-2 ion source, respectively. For the synthesis of CdS nanoparticles using the precipitation method, equal molarity of (0.1 M) Cd(CH3COO)2.4H2O and Na2S.9H2O solution were prepared in separate beakers. Then sodium sulfite solution was added drop wisely through continuous stirring for 2 h at room temperature to form a clear solution. During the reaction, N2 gas was continuously purged through the suspension. Then the yellow precipitate was collected by centrifugation and washed three times with deionized water and ethanol to remove the residue. Finally, the obtained CdS nanoparticle was further dried at 70 ℃ for 5 h. The clean solid precipitate was calcined at 300 ℃ for 2 h in a furnace, ground into powder, and kept in a container [22].
Synthesis of CdS/CeO2 Nanocomposite: In a typical procedure, 0.1 M of the as-synthesized CeO2 powder was dispersed in 100 mL of distilled water and sonicated for 30 min, then 0.1 M of Cd(CH3COO)2.4H2O was added. After 1 h of stirring, equal molarity of Na2S.9H2O solution was added drop wisely into the mixed solution. The precipitate was filtered and washed with distilled water and ethanol several times, and then dried in an oven at 60 ℃ for 24 h to obtain CdS/CeO2 nanocomposite [19]. The CdS/CeO2 nanocomposite was done in four molar ratios (0.5:1, 1:1 and 1:0.5) of CdS: CeO2. The obtained powder was then ground to get fine particles.
Characterization of the as-synthesized photocatalysts
X-ray Diffraction (XRD) study: The structures of all the as-synthesized photocatalysts were examined by XRD at room temperature at a step scan rate of 0.02° (step time: 1s; 2θ range: 5.0-90.4°), which is equipped with an X-ray source of CuKα radiation (wavelength of 0.15406 nm) using 45 kV accelerating voltage and 40 mA applied current. Finally, XRD patterns were collected with X’Pert Pro PANalytical.
Determination of surface area: The specific surface area of each of the as-synthesized photocatalysts was calculated from the N2 adsorption-desorption isotherm at liquid-nitrogen temperature -196 ℃ (77 K) and the micropore surface area was calculated by using the Brunauer-Emmett-Teller (BET) method.
SEM-EDX study: Solid morphologies and particle distribution of the as-synthesized photocatalyst were determined by scanning electron micrographs (SEM Hitachi TM1000 with EDX detector) with a backscattered detector instrument; a gold film was sputtered into the sample before observation. From energy dispersive X-ray [EDX, an acquisition time (s) 40.0; process time 3 h; and an accelerating voltage (kV) 15.0)] link with SEM the elemental percent weight distribution of the as-synthesized sample was determined.
UV/Vis diffuse reflectance study: The optical absorption spectra and band gaps of the as-synthesized photocatalysts were determined using UV/Vis spectrophotometer. The solid-state absorbance of the photocatalyst was measured by scanning over the wavelength range of 200-900 nm.
FTIR study: The as-synthesized photocatalyst was characterized using FTIR (Spectrum 65, PerkinElmer) instrument. The dry mass of the photocatalyst was thoroughly mixed with a given dry mass of KBr and ground to a fine powder. A transparent disc was formed by applying pressure in the moisture-free atmosphere. IR absorption spectrum was recorded between 400 and 4000 cm-1.
Photoluminescence (PL) study: Photoluminescence (PL) spectra were measured at Haramaya University using RF 5301PC Shimadzu photoluminescence. The spectra were obtained in the range of 250 nm - 650 nm.
Photocatalytic degradation studies
Photocatalytic activities of the entire as-synthesized sample were tested for the degradation of an aqueous solution of methyl orange (MeO) dye. For example, in the typical photocatalytic experiment, 10 ppm of MeO was mixed with 0.2 g/L of the photocatalyst. The mixture was magnetically stirred for 1 h in the dark to ensure adsorption/desorption equilibrium. Then the suspension was irradiated with visible light irradiation with continuous stirring using a magnetic stirrer and the absorbance was measured in 20 min time intervals to monitor the reaction of MeO aqueous solution degradation. The distance between the light source and the dye solution is 20 cm. During the process air/oxygen was purged into the solution using a pipette. Then 10 mL suspension was withdrawn at 20 min time interval and centrifuged at 3000 rpm for 10 min. Dye absorbance was determined using a UV/Visible spectrophotometer at the λmax of MeO solution. Percent degradation (%) was calculated using the following equation [23].
(1)
When the concentration is very low, the observed rate constant, kobs (min-1) was determined from the simplified Langmuir-Hinshelwood model as given below [24]:
Rate = ln(Ct/Co) = -kt (2)
Where kobs are the observed rate constant in min-1, Ct is the absorbance at a given time, Co is the absorbance at the initial time and t (min) is the reaction time. Hence, the linear fit between Ct/Co and irradiation time demonstrates the photocatalytic degradation rate. A higher kobs value indicates a better photocatalytic activity of an investigated sample.
Stability test of the as-synthesized photocatalyst
The recycling of the photocatalyst was performed as follows [25]: after a first photodegradation cycle of a 10 ppm solution of methyl orange (MeO) dye using 0.15 g/L of the as-synthesized photocatalyst and 160 min irradiation time, the treated solution of the dye was centrifuged for 10 min to settle the catalyst. The liquid phase was filtered and then the solid phase containing the photocatalyst was carefully separated for reuse. The recovered photocatalyst was washed with a sufficient amount of deionized water and ethanol. Finally, the photocatalyst was dried in an oven for 12 h at 100 ℃ before the use for the next catalytic cycle and then reintroduced into the fresh cycle. The process was repeated four times. The 10 mL suspension was withdrawn at 20 min time interval and centrifuged at 3000 rpm for 10 min. The MeO degradation and photocatalytic stability of the as-synthesized photocatalyst layer were measured at the end of each cycle.
Characterization of the as-synthesized photocatalysts
XRD analysis: X-ray diffraction is the most powerful and successful technique commonly used for determining the structure of crystals and the arrangement of atoms within a crystal [26]. The characteristic peaks on the XRD patterns of the as-synthesized photocatalyst: CeO2, CdS, and CdS/CeO2 were shown in Figure 1.
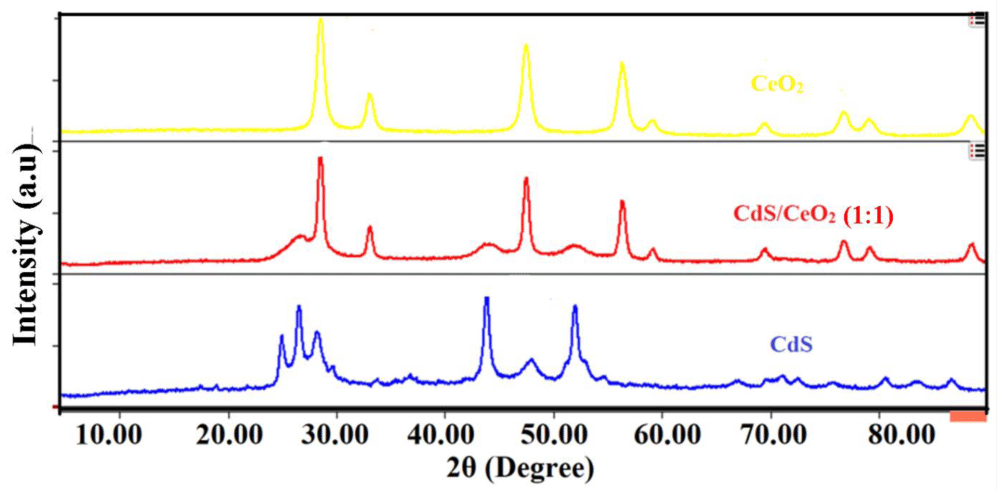
Figure 1: XRD spectra of CeO2, CdS and CdS/CeO2 (1:1) photocatalysts.
Accordingly, diffraction peaks observed at scattering angle observed at 2θ of 28.52, 33.19, 47.38, 56.54, 59.09, 70.01, 76.78, 78.99 and 88.24° corresponding to (111), (200), (202), (311), (222), (400), (313), (402) and (422) lattice plane respectively represents the cubic fluorite structure of CeO2 [27]. The broad peaks observed at 2θ of 25.02, 26.42, 28.19, 36.24, 43.55, 48.00, 52.02, 54.66, 67.03, 70.11, 71.34, 72.81, 76.03, 80.52 and 83.44° corresponding to (100), (002), (101), (012), (110), (013), (112), (044), (023), (210), (211), (114), (212), (300) and (213) crystal plane can be ascribed to the hexagonal greenockite structure of CdS nanoparticle [28,29]. The broadening of the diffraction peak indicates the nanocrystalline nature of the samples and provides information about crystallite size. As the width increases, the particle size decreases and vice versa [30].
In the case of the CdS/CeO2 binary system, most of the diffraction peaks observed could be ascribed to the cubic fluorite structure of CeO2 nanoparticles. However, diffraction peaks at 2θ values of 26.82, 44.01, and 52.21° indicate the presence of hexagonal greenockite structure of CdS in the binary system [19,31]. No other phases can be observed in the XRD patterns of CdS/CeO2 nanocomposite, suggesting that no impurity exists in the sample. It is found that the diffraction peaks for both CeO2 and CdS can be observed from the XRD pattern of the composite, indicating the formation of the CdS/CeO2 composite. The absence of other peaks in the XRD pattern of core/shell composite implies that it only consists of CeO2 and CdS.
The average crystallite size of each of the as-synthesized photocatalysts was calculated using the Debye-Scherrer formula [32];
(3)
Where, D = crystallite size in nm, K = the shape factor constant taken as 0.9; β is the full width at half maximum (FWHM) in radians, λ is the wavelength of the X-ray (0.15406 nm) for Cu target Kα1 radiation, and θ is the Bragg’s angle. Generally, the calculated average crystalline size of the as-synthesized photocatalyst confirms the involvement of a good crystalline nano range between 10 and 50 nm [33] as summarized in Table 1.
| Table 1 : The crystal size of the as-synthesized photocatalysts. | |||
| Photocatalyst | 2θ (degree) | β (radians) | D (nm) |
| CeO2 | 28.52 | 0.02804 | 18.406 |
| CdS | 43.55 | 0.02338 | 23.576 |
| CdS/CeO2 (1:1) | 28.61 | 0.01004 | 47.992 |
Determination of surface area (BET): The surface area of the as-synthesized nanocomposite was determined by the Brunauer-Emmett-Teller (BET) method. Table 2 shows the specific surface area of each sample investigated by nitrogen adsorption-desorption isotherm analysis. The specific surface area is largest for CeO2 (77 m2g-1) whereas lowest for Ag3PO4 (0.122 m2g-1) showing the compacted nature of the latter.
| Table 2 : The specific surface area of the as-synthesized photocatalysts | |
| As-synthesized photocatalyst | BET surface area (m2g-1) |
| CeO2 | 37.6739 ± 0.1923 |
| CdS | 17.4935 ± 0.0745 |
| CdS/CeO2 (1:0.5) | 43.8627 ± 0.7335 |
| CdS/CeO2 (1:1) | 44.3277 ± 0.0012 |
| CdS/CeO2 (0.5:1) | 43.5162 ± 0.1108 |
As indicated in Table 2, the specific surface area can be calculated and those of single and binary nanocomposites which is about 43.8627, 44.3277, 43.5162, 17.4935, and 37.6739 m2g-1 for the obtained CdS/CeO2 (1:0.5), CdS/CeO2 (1:1), CdS/CeO2 (0.5:1), CdS and CeO2 samples, respectively. The CdS/CeO2 (1:1) composite has the largest specific surface area may be because the modification of CeO2 can increase the dispersion of the CdS nanoparticle, as well as because the CeO2 nanoparticles have a relatively large surface area. It is expected that this can facilitate enhancing the adsorption of reactant molecules and, thereby, the enhanced photocatalytic activity [34].
SEM-EDX image study: Morphological images of the as-synthesized photocatalysts; CeO2, CdS, and CdS/CeO2 were investigated as shown in Figure 2a-c respectively.
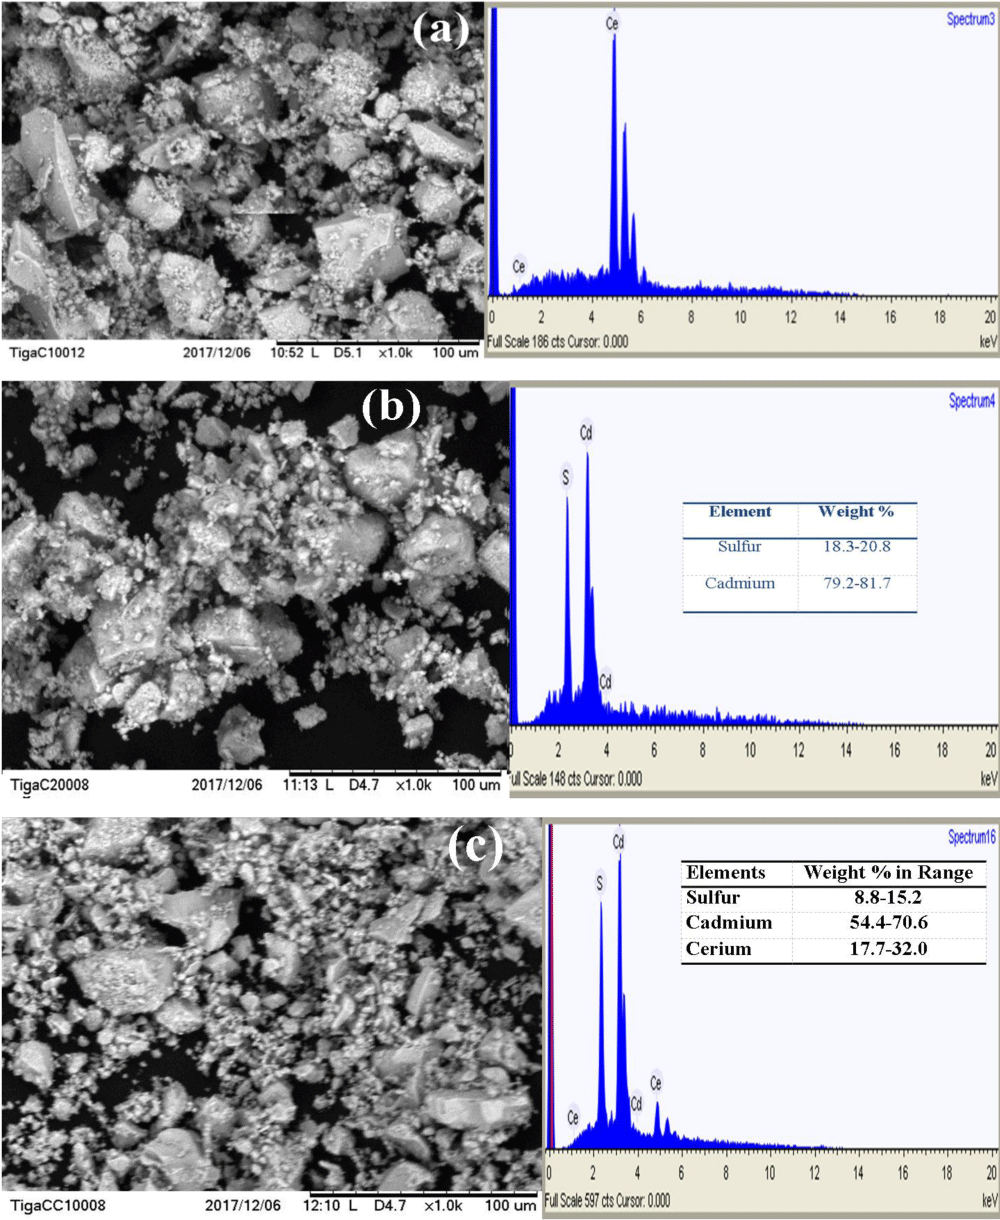
Figure 2: SEM-EDX images of (a) CeO2, (b) CdS and (c) CdS/CeO2 (1:1) photocatalyst.
The EDX spectrum shows the presence of all the relevant components in each photocatalyst. According to the SEM images shown in Figure 2a, the morphology of the CeO2 nanoparticle is observed to be nearly spherical with slight agglomeration (single-phase). From the SEM image shown in Figure 2b, it is noticed that the surface morphologies are in the form of assemblies of CdS nanoparticles and uniformly distributed over the entire surface. The EDX spectrum and elemental mapping show that the CdS nanoparticle contains average stoichiometric composition with 80.45% of cadmium and 19.55% of sulfur. As can be seen from Figure 2c, the CdS/CeO2 composite also exhibited no distinct morphology, though cubic-like structures appeared rarely. On the other hand, the percent chemical distribution gradients across the surface of the sample (w/w %) were determined from the results of energy dispersive X-ray (EDX) analysis. The elemental composition (weight %) of the CdS/CeO2 photocatalysts contains average stoichiometric composition with 24.85% of cerium, 62.5% of cadmium, and 12% of sulfur. Interestingly, the EDX spectrum result exhibits the presence of Ce, Cd, and S peaks indicating the CeO2 and CdS nanoparticles [21].
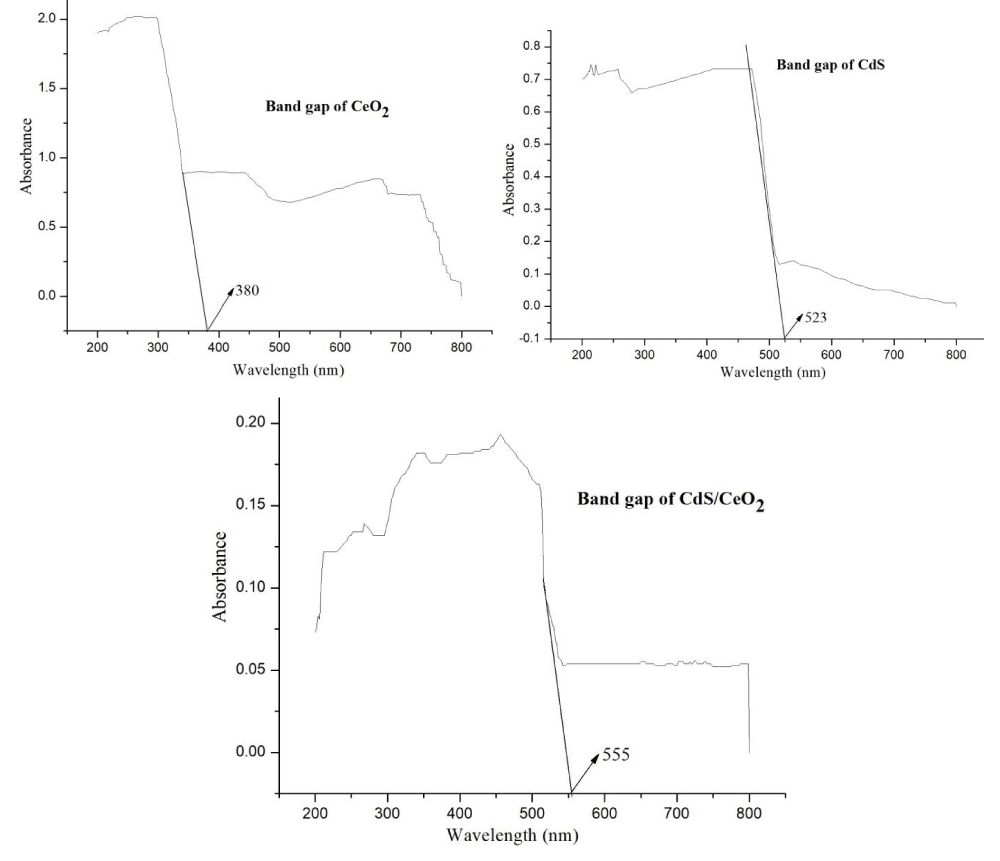
UV/Vis diffuse absorption spectra of the as-synthesized photocatalysts: UV/Vis diffuse absorption edges of the as-synthesized photocatalysts are obtained from a plot of absorbance against wavelength.
The intercept of the tangent line on descending part of the absorption peak at the wavelength axis gives the value of the diffuse absorption edge (nm). In such a case bandgap energy (Eg) of the as-synthesized photocatalysts was obtained from equation 4 [35].
(4)
Where Eg is bandgap energy in electron volts and λmax is the wavelength (nm) corresponding to the absorption edge.
But estimating the bandgap using the above approach sometimes may not provide a clear tangential line when the peak is not well resolved for the samples. To avoid the difficulties in obtaining band gap energy from UV/V is absorption spectroscopy in dispersed samples, diffuse reflectance measurements of dry powders can be performed. The optical absorption properties of each of the as-synthesized photocatalysts were investigated by using a UV/Vis diffuse reflectance spectrometer in the range of 200-900 nm. The bandgap values of the photocatalysts were determined by analyzing the optical data with the expression for the optical absorbance α and the photon energy hv using Tauc’s plot [36-38].
αhν = A (hν - Eg)n/2 (5)
Where α is the absorption coefficient, which is proportional to the absorbance, h is the Planck’s constant (J.s), v is the light frequency (s-1), A is the absorption constant, Eg the band gap energy and n is a constant related to the electronic interband transition. n = 2 for an indirect allowed transition (plotted as (αhv))1/2 versus Eg), n = 3 for an indirect forbidden transition (plotted as (ahv)1/3 versus Eg), n = )1/2 for a direct allowed transition (plotted as (ahv)2 versus Eg), n = 3/2 for a direct forbidden transition [plotted as (ahv)2/3 versus Eg] [39]. The band gaps were then determined by extrapolating the straight-line portion of the (ahv)2 versus (hv) graphs to the (hv) axis until (ahv)1/n = 0 the linear section of this spectra as shown in Figure 3.
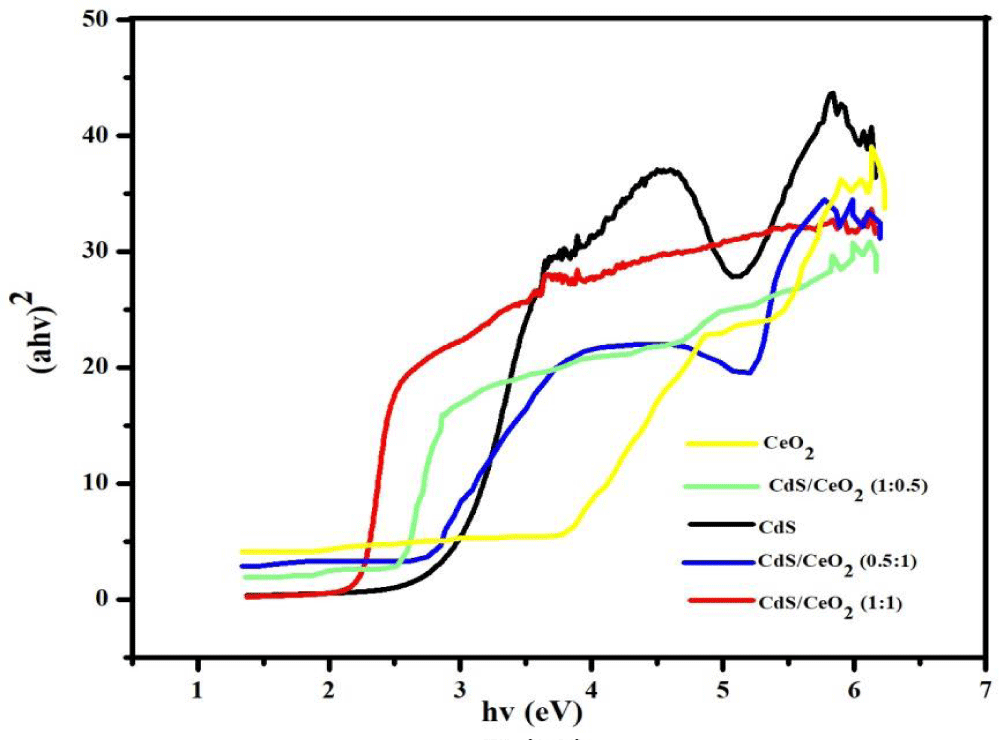
Figure 3: Tauc plot of single (CeO2 and CdS) and binary CdS/CeO2 (in different molar ratio) photocatalyst.
The absorption edges of the binary (CdS/CeO2) photocatalysts are well extended to visible regions of the spectrum as compared to the single nanoparticles.
This may be due to the effect of modification in the electronic levels of every single nanoparticle by making them binary composite.
Based on Tauc’s plot as equation (5) the band gaps for all the as-synthesized materials were displayed in Table 3. The calculated band gaps of the single systems: CeO2 and CdS are found to be 3.26 eV and 2.48 eV respectively. These findings are similar to previous reports made on these nanoparticles [21,23,40,41]. The binary systems CdS/CeO2 (molar ratio: 1:0.5, 1:1 and 0.5:1) have band gaps of 2.27 eV, 2.23 eV and 2.29 eV respectively. This finding is also similar to previous reports made on the same nanoparticles [19,21,23].
| Table 3: Maximum wavelength and bandgap energy (Eg) of the as-synthesized photocatalysts. | ||
| As-synthesized photocatalyst | Max. Wavelength | Bandgap (Eg) eV |
| CeO2 | 380 | 3.26 |
| CdS | 500 | 2.48 |
| CdS/CeO2 (1:0.5) | 546 | 2.27 |
| CdS/CeO2 (0.5:1) | 542 | 2.29 |
| CdS/CeO2 (1:1) | 555 | 2.23 |
FTIR study of the as-synthesized photocatalysts: The FTIR spectrum in the mid-infrared region is the feature of a particular compound that gives information about the functional groups, molecular geometry, and intra/inter-molecular interactions. Both inorganic and organic materials can be analyzed in the spectrum.
From the as-synthesized photocatalyst, the functional groups of CeO2 were analyzed by FTIR in the range from 400 to 4000 cm-1 and displayed in Figure 4. In the case of CeO2, the band at 3435 and 1620 cm-1 corresponds to the O-H stretching vibration and -OH scissor bending mode respectively, which originated from physically absorbed (H-bonded) water molecules or surface -OH groups [42,43]. The band located around 1047 cm-1 has been attributed to the C-O stretching vibration may be from the additional CO2 that was absorbed in the CeO2 surface [44]. The wideband at 1315 cm-1 consists of the symmetrical stretching mode of N = O and the inside bending mode of N-H. The peak at 850 cm-1 is attributed to the outside bending mode of N-H [45,46].
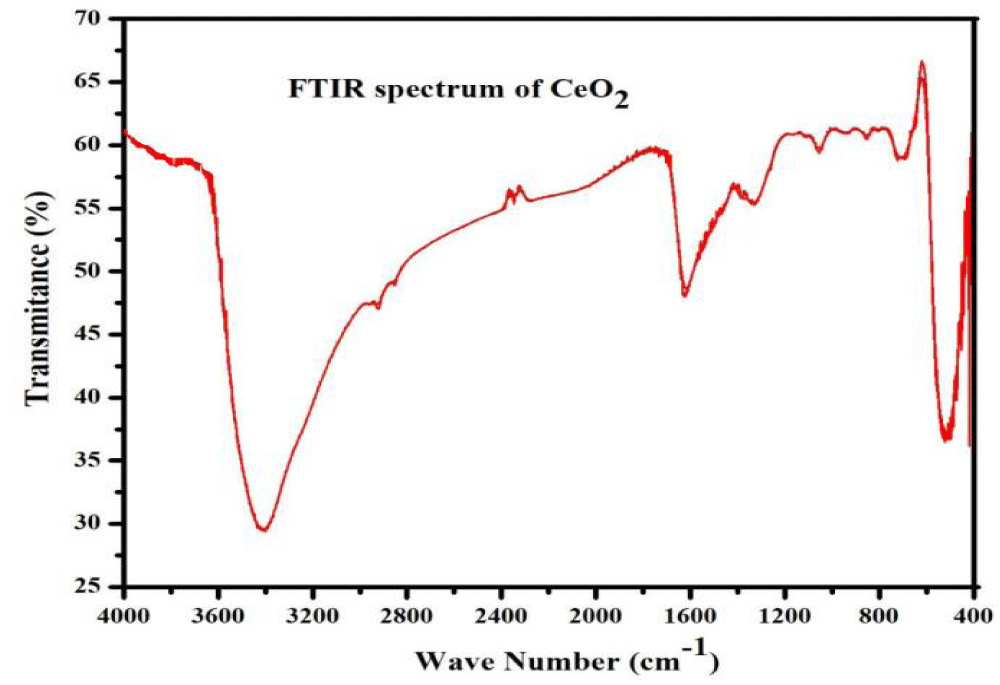
Figure 4: FTIR spectrum of CeO2 nanoparticle.
The peaks observed at 1387 cm-1 could be ascribed to the stretching vibration of N-O nitrate groups (NO3-) which resulted from a precursor solution of Ce(NO3)3.6H2O that was used to synthesize the nanoparticle (CeO2) [47]. The intense band at 521 cm-1 corresponds to the Ce-O stretching vibration [21,48].
Photoluminescence (PL) study of the as-synthesized photocatalysts: PL is mainly used as a diagnostic and development tool in semiconductor research, since it can provide information about the electronic structure and the emission mechanism of the material [49]. The PL emission spectra of different photocatalysts (CeO2, CdS and CdS/CeO2 (in 0.5:1, 1:1 and 1:0.5 molar ratios) were determined. The order of intensity is CeO2 > CdS > CdS/CeO2 (0.5:1) > CdS/CeO2 (1:0.5) > CdS/CeO2 (1:1) as indicated in the Figure 5.
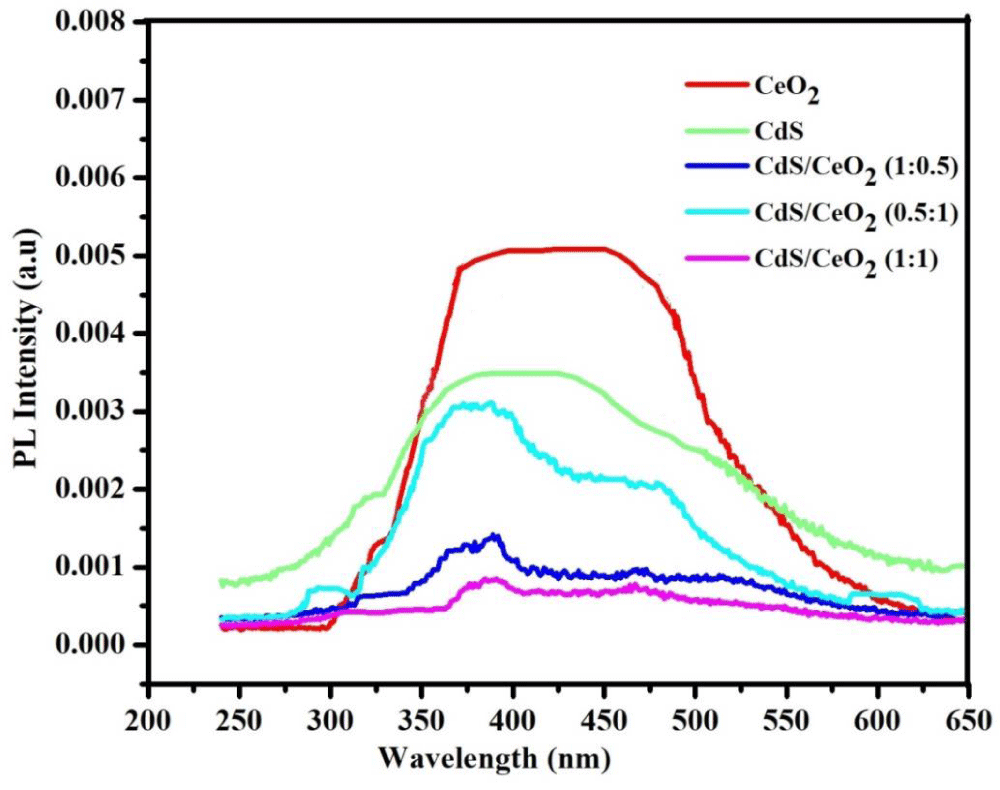
Figure 5: The PL emission spectra of CeO2, CdS and CdS/CeO2 (in 0.5:1, 1:1 and 1:0.5 molar ratios) photocatalyst.
In binary nanocomposite, the photoinduced electrons and holes can be effectively separated, and hence excitation PL intensity goes down. This is because, the lower the excitation PL intensity, the stronger the capacity of coupled materials to capture photoinduced electrons, the higher the separation rate of photoinduced electrons and holes, and the higher the photocatalytic activity [50]. So, in this study, it was observed that the lower PL emission spectra were recorded for CdS/CeO2 (1:1) nanocomposite.
This might be also due to the photogenerated electron-hole pair in CeO2 separated well due to the synergy effect of coupling of A-type heterojunction (CdS/CeO2). In general, the PL intensities of single systems were found to be higher than the binary system photocatalyst.
Photocatalytic studies
Photocatalytic activities of the as-synthesized photocatalysts: Methyl orange (MeO), with a characteristic absorption at 464 nm is chosen as a typical organic pollutant for testing the photocatalytic activity of the as-prepared products. The photocatalytic activities of all the as-synthesized samples were evaluated by testing their ability in the degradation of MeO (initial dye concentration of 10 ppm and catalyst load of 0.2 g/L) under 160 min visible irradiation time. The degradation rate was analyzed by plotting Ct/Co versus irradiation time. The results show that the characteristic absorption peaks corresponding to MeO decrease rapidly as the exposure time increases, indicating the decomposition of MeO and the significant reduction in the MeO concentration.
The photocatalytic performance of CeO2, CdS, and CdS/CeO2 (in 0.5:1, 1:1, and 1:0.5 molar ratios) photocatalyst was first evaluated by the degradation of model pollutant MeO under visible light irradiation. Before the photocatalytic reaction, an adsorption step in dark conditions was allowed to take place for 60 min. The result indicates that the adsorption capacity of binary and single photocatalyst become in the order of CeO2 < CdS < CdS/CeO2 (0.5:1) < CdS/CeO2 (1:0.5) < CdS/CeO2 (1:1). The photocatalytic activities of pure CeO2 and CdS were lower than that of the composite photocatalyst. They decolorized 18.58, 27.07, 32.06, 35.98, and 53.73% of MeO in 160 min of irradiation time respectively. The photocatalytic activities of pure CeO2 are lower than CdS due to its higher bandgap energy which makes it less sensitive to visible irradiation unlike other single counterparts [51].
The increment of photocatalytic degradation efficiency of CdS from that of CeO2 over MeO solution is due to the efficient charge separation, narrow bandgap that makes it sensitive to the visible portion of the spectrum, less electron-hole recombination, and a wide range of optical absorption of light by the composite could be possible reasons for the enhanced photoactivity [49]. In the A-type heterojunction system CdS/CeO2 (1:1), the increased photocatalytic activities of CeO2 could be initiated by conduction band electrons of CdS that involve in the photoreduction process [30].
There are many reports available on the photocatalytic degradation efficiency of binary nanocomposite (A-type) over different azo dyes (MeO). For A-type heterojunction, CdS/CeO2, CdS/ZnO and CdS/TiO2 also shows percent decolorization about 38.00, 49.30, and 55.00% over methyl orange dye respectively in different irradiation time [21,52,53]. In our case 53.73% for A-type heterojunction in 160 min irradiation time which is partially in line with the previous reports on both heterojunction.
The kinetics of the photocatalytic degradation was also exhibited using the pseudo-first-order reaction [54]. The rate constant of the binary CdS/CeO2 (1:1) nanocomposite was higher than single and binary in other ratio photocatalysts, indicating the presence of a synergistic effect as indicated in Table 4, Figure 6. Among them, the apparent rate constants of CdS/CeO2 (1:1) were the highest, calculated based on the equation ln(Ct/Co) per irradiation time, and it was almost 18, 12, 8.9, and 6.13 times higher than that of CeO2, CdS, CdS/CeO2 (0.5:1), and CdS/CeO2 (1:0.5) respectively.
| Table 4: The apparent rate constants and % degradation of the as-synthesized photocatalysts after 160 min. | ||
| As-synthesized photocatalyst | Degradation (%) | The rate constant, k (× 10-4 min-1) |
| CeO2 | 18.58 | 9.006 |
| CdS | 27.07 | 55.210 |
| CdS/CeO2 (1:1) | 53.73 | 162.11 |
| CdS/CeO2 (0.5:1) CdS/CeO2 (1:0.5) |
32.06 35.98 |
80.150 108.072 |
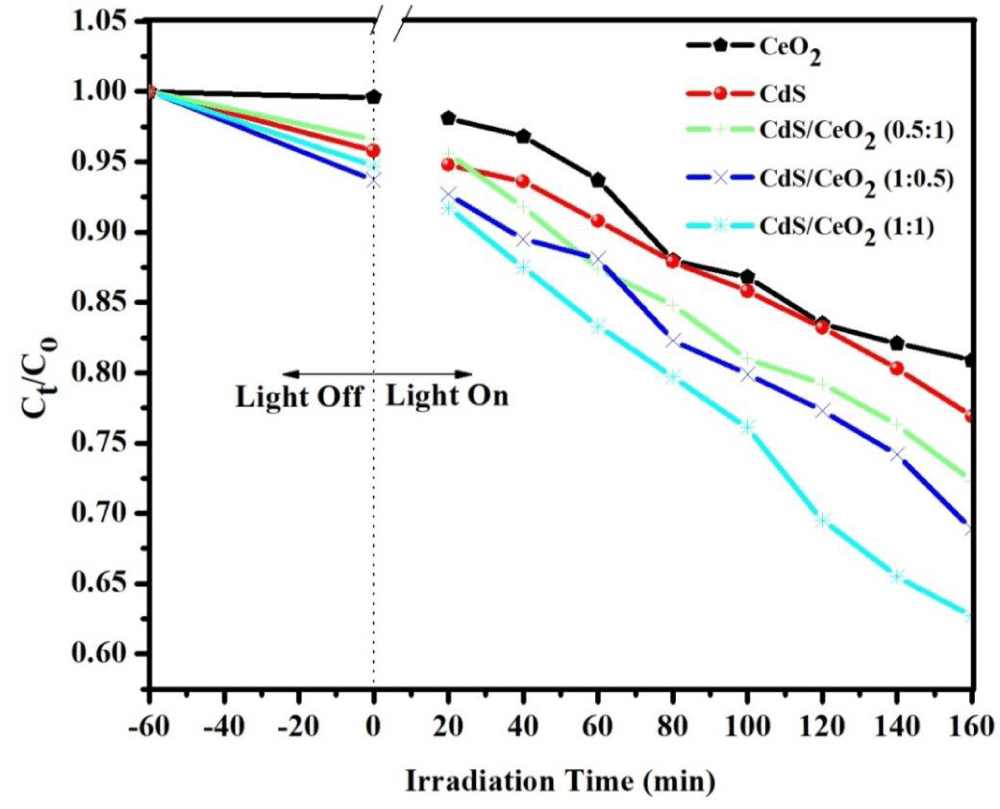
Figure 6: Degradation efficiency of the as-synthesized photocatalyst [CeO2, CdS, CdS/CeO2 (in different ratio) as function of visible irradiation time.
Photocatalytic stability of the as-synthesized photocatalyst
In addition to photocatalytic efficiency, the stability of photocatalyst is also very important for practical application. To evaluate the stability of photocatalytic performance of binary CdS/CeO2 (1:1), the circulating run in the photocatalytic degradation of MeO was carried out under visible light irradiation. The process was repeated up to four times. As exhibited in Figure 7 the studies revealed that the composite demonstrated moderate stability after recovery.
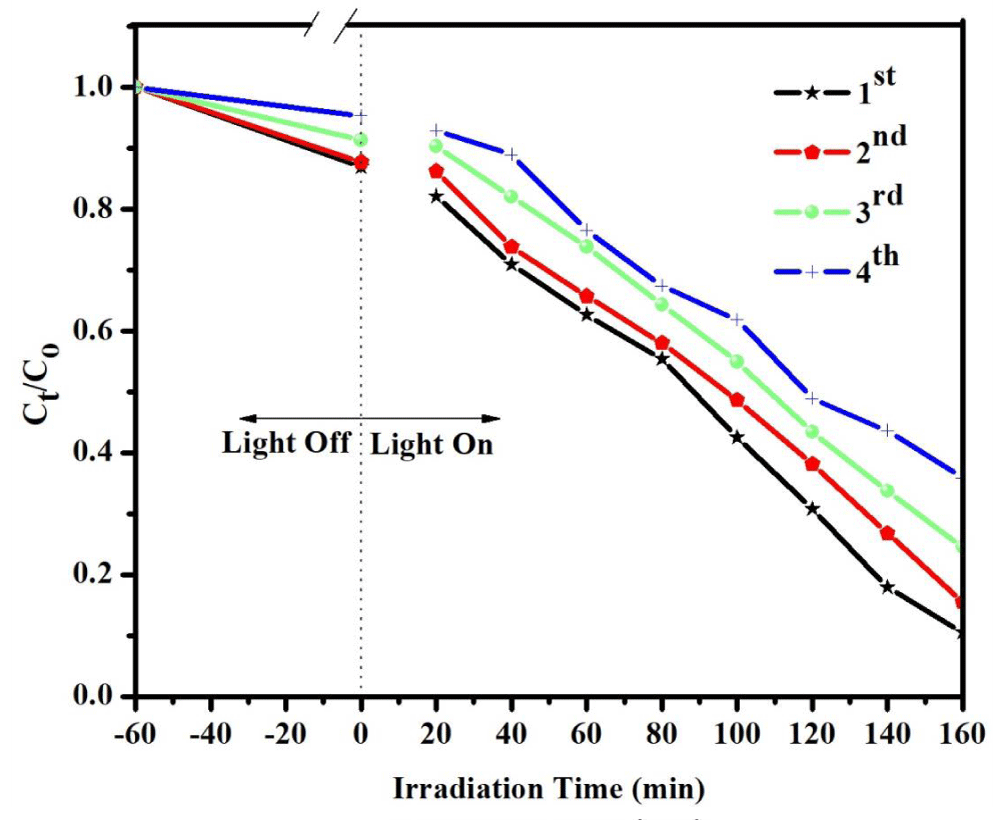
Figure 7: Degradation rate of MeO using CdS/CeO2 (1:1) photocatalyst as a function of irradiation time in different cycles (load at 0.15 g/L, initial concentration of MeO at 10 ppm, and pH at 4).
In the first cycle, 53.16% of the dye was degraded after 160 min of irradiation time. Subsequently, the second, third, and fourth cycles degraded 38.71, 23.17, and 17.41% of the dye corresponding to the rate constant (k) from 0.00493 to 0.00310, 0.00201, and 0.00120 min-1 respectively. Agglomeration and sedimentation of the dye around the composite particles after each cycle of photocatalytic degradation is a possible cause of the observed decrease in the degradation rate because each time the photocatalyst is reused new parts of the photocatalyst surface become unavailable for dye adsorption and thus photon absorption, reducing the efficiency of the catalytic reaction [55,56]. Besides, one might expect a loss in the photocatalyst during recycling which eventually affects catalytic activity after each cycle.
This decreases the degradation rate of the as-synthesized photocatalyst may be due to the weakening of the absorbance ability of the catalyst or the loss of some catalyst during the cycling reaction. The result demonstrates that CdS/CeO2 (1:1) nanocomposite shows good photocatalytic performance as well as moderate stability after 4 cycles in 160 min.
General proposed mechanism of degradation of MeO using CdS/CeO2
According to the above experimental research, a probable mechanism of charge transfer and photocatalytic degradation of organic pollutant methyl orange (MeO) over the CdS/CeO2 nanocomposite under visible light irradiation is put forward and illustrated in Figure 8. The light illumination on CdS/CeO2 nanocomposite causes the generation of electron (e-) in the conduction band (CB) and holes (h+) in the valence band (VB).
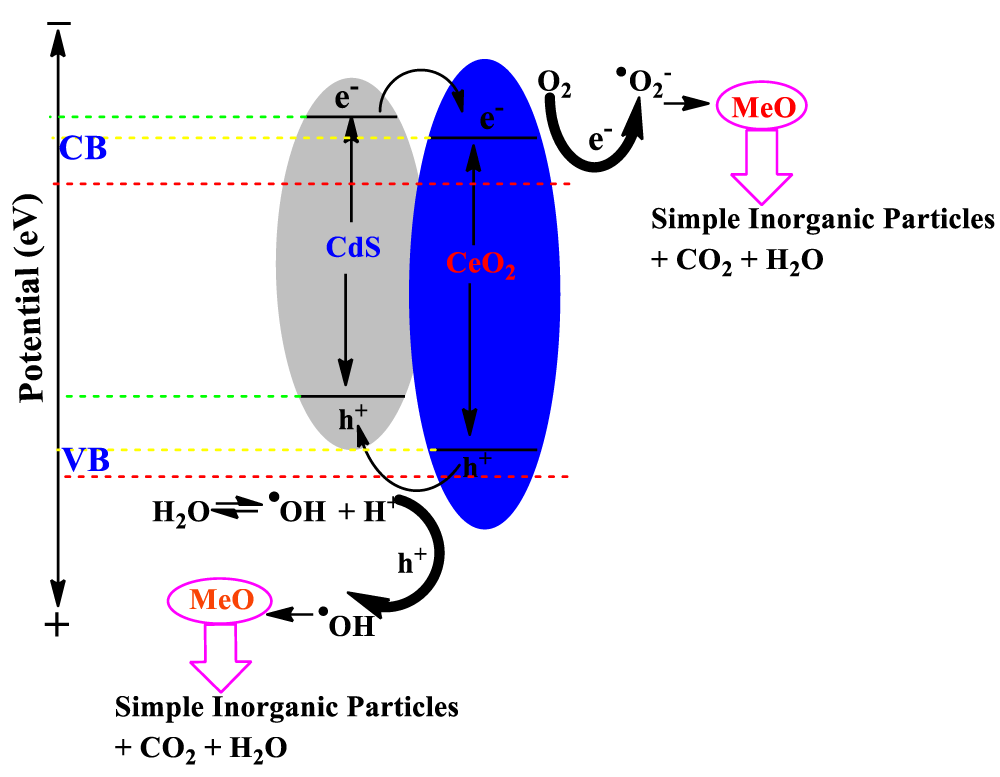
Figure 8: Mechanism of photocatalytic degradation of organic contaminant (MeO) by CdS/CeO2 photocatalyst under visible light irradiation.
Under visible light irradiation, the CdS can be activated, and the photoinduced electrons at the conduction band of CdS are transferred to the conduction band of CeO2. The electrons will then react with water to produce hydrogen. On the other hand, the photoexcited holes at the valence band of CdS nanoparticles are captured by the MeO dye.
At the CB site, molecular oxygen (O2) forms superoxide radical •O2- in the presence of the photoexcited CB e- and subsequently reacts with H+ to form HO2• radical species. During the e- transfer from CdS to CB of CeO2, the generated photoinduced h+ in VB might react with water (H2O) and the adsorbed MeO dye molecule to yield hydroxyl radical (•OH) and MeO•- anions radical respectively [57]. On the other hand, electrons in the CeO2 CB can migrate to its VB, while the holes generated in the CeO2 VB move to the CdS VB surface [58]. It is known that these oxygenous radicals (•O2-, •OH, and HO2•) act as potential oxidizing and reducing species for the degradation of organic molecules (MeO) [59]. The proposed photoreaction mechanism of CdS/CeO2 composite over MeO degradation under visible light follows:
CdS/CeO2 + hv → h+VB + e-CB (6)
Oxidative reaction
h+VB + H2O → H+ + •OH (7)
•OH + MeO → (Intermediates) → CO2 + H2O
Reductive reaction
e-CB + O2 → •O2- (8)
•O2- +MeO → (Intermediates) → CO2 + H2O
Generally
•O2- (•OH, h+) + MeO +O2/H2O → Degradation products (9)
In our case, in comparison with single and binary photocatalysts, the superior photocatalytic activity of binary nanocomposite under visible light might result from the enhanced charge separation and the formation of more active radicals (•O2- and •OH) which are induced by the synergetic effect between CdS and CeO2. As a result, CdS/CeO2 nanocomposite delivers high photogenerated e--h+ pair charge separation and produces sufficiently high amounts of radicals for the high degradation of MeO dye under visible light irradiation. The photocatalytic performance of the photocatalyst mainly depends on: (i) its light absorption properties; (ii) the rates of reduction and oxidation on the surface of the catalyst by the electrons and holes; and (iii) the electron-hole recombination rate [60].
Declaration of competing interest
This manuscript entitled “Synthesis and Characterization of CdS/CeO2 Nanocomposite with Improved Visible-Light Photocatalytic Degradation of Methyl Orange Dye” consists of 3 tables and 8 figures. It has not been published previously; it is not under consideration for publication elsewhere. If accepted, it will not be published elsewhere in the same form, in English, or any other language.
Author’s contributions
Tigabu Bekele prepared the sample and experimented on the XRD, BET, SEM-EDX, UV/Vis, FT-IR, PL, and MeO dye degradation. He also did conceptualization, writing-original drafts, communication, review and editing, and supervision.
The author is grateful to the College of Natural and Computational Sciences at Mekdela Amba University for their contributions in the process of developing the manuscript, preparing different workshops, and provision of various services.
Supplementary File
Supplementary File:
- Ahmed J, Thakur A, Goyal A. Industrial wastewater and its toxic effects. Biological Treatment of Industrial Wastewater. 2021; 1-14.
- Jalil AA, Triwahyono S, Adam SH, Rahim ND, Aziz MA, Hairom NH, Razali NA, Abidin MA, Mohamadiah MK. Adsorption of methyl orange from aqueous solution onto calcined Lapindo volcanic mud. J Hazard Mater. 2010 Sep 15;181(1-3):755-62. doi: 10.1016/j.jhazmat.2010.05.078. Epub 2010 May 24. PMID: 20538408.
- Sharma V, Kakodia A, Sharma B, Pamecha S, Khandelwal R. Photocatalytic degradation of Brilliant Blue-R by ZnO in aqueous media. International Journal of Green and Herbal Chemistry. 2013; 2(3): 730-736.
- Kansal S, Kaur N, Singh S. Photocatalytic degradation of two commercial reactive dyes in aqueous phase using nanophotocatalysts. Nanoscale Res Lett. 2009 Apr 10;4(7):709-16. doi: 10.1007/s11671-009-9300-3. PMID: 20596421; PMCID: PMC2894065.
- Prabha I and Lathasree S. Photocatalytic performance of nanocatalyst for the effective removal of dye in the wastewater. Chemical Science Transactions. 2013; 2(1): 220-224.
- Ullah I, Ali S, Hanif M, Shahid S. Nanoscience for environmental remediation: A Review. International Journal of Chemical and Biochemical Sciences. 2012; 2: 60-77.
- Tobin JM, McCabe TJD, Prentice AW, Holzer S, Lloyd GO, Paterson MJ, Arrighi V, Cormack PAG and Vilela F. Polymer-supported photosensitizers for oxidative organic transformations in flow and under visible light irradiation. ACS Catalysis. 2017; 7: 4602-4612.
- Kou J, Lu C, Wang J, Chen Y, Xu Z, Varma RS. Selectivity Enhancement in Heterogeneous Photocatalytic Transformations. Chem Rev. 2017 Feb 8;117(3):1445-1514. doi: 10.1021/acs.chemrev.6b00396. Epub 2017 Jan 17. PMID: 28093903.
- Bora LV and Mewada RK. Visible/solar light active photocatalysts for organic effluent treatment: Fundamentals, mechanisms and parametric review. Renewable and Sustainable Energy Reviews. 2017; 76: 1393-1421.
- Boyjoo Y, Sun H, Liu J, Pareek VK and Wang SA. Review on photocatalysis for air treatment: From catalyst development to reactor design. Chemical Engineering Journal. 2017; 310: 537-559.
- Yuhas BD, Smeigh AL, Douvalis AP, Wasielewski MR, Kanatzidis MG. Photocatalytic hydrogen evolution from FeMoS-based biomimetic chalcogels. J Am Chem Soc. 2012 Jun 27; 134(25):10353-6. doi: 10.1021/ja303640s. Epub 2012 Jun 13. PMID: 22662744.
- Lu X, Zhai T, Cui H, Shi J, Xie S, Huang Y, Liang C, Tong Y. Redox cycles promoting photocatalytic hydrogen evolution of CeO2 nanorods. Journals of Material Chemistry. 2011; 21(15): 5569-5572.
- Zhang J, Li L, Huang X and Li G. Fabrication of Ag-CeO2 core-shell nanospheres with enhanced catalytic performance due to strengthening of the interfacial interactions. Journal of Material Chemistry. 2012; 22(21): 10480-10487.
- Kusmierek E, A CeO2 Semiconductor as a photocatalytic and photoelectrocatalytic material for the remediation of pollutants in industrial wastewater: A Review. Catalysts. 2020; 10: 1435.
- Koli, Valmiki B, Kim and Jung-Sik Photocatalytic oxidation for removal of gases toluene by TiO2-CeO2 nanocomposites under UV light irradiation. Materials Science in Semiconductor Processing. 2019; 94: 70-79.
- Dytrych P, Kluson P, Dzik P, Vesely M, Morozova M, Sedlakova Z, Solcova O. Photo-electrochemical properties of ZnO and TiO2 layers in ionic liquid environment. Catalysis Today. 2014; 230: 152.157.
- Reddy BM, Khan A, Lakshmanan P, Aouine M, Loridant S, Volta JC. Structural characterization of nanosized CeO(2)-SiO(2), CeO(2)-TiO(2), and CeO(2)-ZrO(2) catalysts by XRD, Raman, and HREM techniques. J Phys Chem B. 2005 Mar 3;109(8):3355-63. doi: 10.1021/jp045193h. PMID: 16851365.
- SongY, Zhao H, Chen Z, Wang W, Huang L, Xu H, Li H. The CeO2/Ag3PO4photocatalyst with stability and high photocatalytic activity under visible light irradiation. Physical Status Solidi A. 2016; 213(9): 2356-2363.
- You DT, Pan B, Jiang F, Zhou YG, Su WY. CdS nanoparticles/CeO2 nanorods composite with high-efficiency visible-light-driven photocatalytic activity. Applied Surface Science. 2016; 363: 154-160.
- Gogoi A and Sarma CK. Synthesis of the novel β-cyclodextrin supported CeO2 nanoparticles for the catalytic degradation of methylene blue in aqueous suspension. Materials Chemistry and Physics. 2017; 194: 327-336.
- Taddesse AM, Bekele T, Diaz I, Adgo A. Polyaniline supported CdS/CeO2/Ag3PO4 nanocomposite: An “A-B” type tandem n-n heterojunctions with enhanced photocatalytic activity. Journal of Photochemistry and Photobiology, A: Chemistry, 2021; 406: 113005.
- Singh V, Sharma P and Chauhan P. Synthesis of CdS nanoparticles with enhanced optical properties. Material Characterization, 2011; 62(1): 43-52.
- Hong RY, Li JH, Chen LL, Liu DQ, Li HZ, Zheng Y, Ding J. Synthesis, surface modification and photocatalytic property of ZnO nanoparticles. Journal of Powder Technology. 2009; 189: 426-432.
- Liu B, Zhao X, Terashima C, Fujishima A, Nakata K. Thermodynamic and kinetic analysis of heterogeneous photocatalysis for semiconductor systems. Phys Chem Chem Phys. 2014 May 21;16(19):8751-60. doi: 10.1039/c3cp55317e. PMID: 24675975.
- Saggioro EM, Oliveira AS, Pavesi T, Maia CG, Ferreira LF, Moreira JC. Use of titanium dioxide photocatalysis on the remediation of model textile wastewaters containing azo dyes. Molecules. 2011 Dec 14;16(12):10370-86. doi: 10.3390/molecules161210370. PMID: 22169940; PMCID: PMC6264266.
- Leng Y. Materials characterization: Introduction to microscopic and spectroscopic methods, John Wiley and Sons (Asia) Pte Ltd. 2008.
- Roggenbuck J, Schaer H, Tsoncheva T, Minchev C, Hanss J, Tiemann M. Mesoporous CeO2: Synthesis by nanocasting, characterization and catalytic properties. Microporous and Mesoporous Materials. 2007; 101: 335-341.
- Hernandez-Gordillo A, Romero AG, Tzompantzi F, Gomez R. New nanostructured CdS fibers for the photocatalytic reduction of 4-nitrophenol. Powder Technology. 2013; 250: 97-102.
- Zhang X, Zhang N, Xu Y, Tang ZR. One-dimensional CdS nanowires CeO2 nanoparticles composites with boosted photocatalytic activity. New Journal of Chemistry. 2015; 39: 6756-6764.
- Banerjee R, Jayakrishnan R, Ayyub P. Effect of the size induced structural transformation on the band gap in CdS nanoparticles. Journal of Physics: Condensed Matter. 2000; 12: 10647-10654.
- Ijaz S, Ehsan MF, Ashiq MN, Karamat N, He T. Preparation of CdS/CeO2 core/shell composite for photocatalytic reduction of CO2 under visible-light irradiation. Applied Surface Science. 2016; 390: 550-559.
- Gupta V, Gupta AR, Kant V. Synthesis, characterization and biomedical application of nanoparticles. Science International. 2013; 1(5): 167-174.
- Raza MA, Kanwal Z, Rauf A, Sabri AN, Riaz S, Naseem S. Size- and Shape-Dependent Antibacterial Studies of Silver Nanoparticles Synthesized by Wet Chemical Routes. Nanomaterials (Basel). 2016 Apr 15;6(4):74. doi: 10.3390/nano6040074. PMID: 28335201; PMCID: PMC5302562.
- Shen Z, Chen G, Yu Y, Wang Q, Zhou C, Hao L, Li Y, He L, Mu R. Sonochemistry synthesis of nanocrystals embedded in a MoO3/CdS core-shell photocatalyst with enhanced hydrogen production and photodegradation. Journal of Material Chemistry. 2012; 22: 19646-19651.
- El-Kemary M, El-shamy H, El-mahasseb I. Photocatalytic degradation of Ciprofloxacin drug in water using ZnO nanoparticles. Journal of Luminescence. 2010; 130: 2327-2331.
- Kubelka P, Munk F. Use of diffuse reflectance spectroscopy for optical characterization of un-supported nanostructures. Journal of Applied Physics.1931; 12: 593-620.
- Tauc T, Abeies F. Optical properties of solids. IOP Publishing Ltd, North Holland, Amsterdam. 1970; 903.
- Zou Z, Qiu Y, Xie C, Xu J, Luo Y, Wang C, Yan H. CdS/TiO2 nanocomposite film and its enhanced photoelectric responses to dry air and formaldehyde induced by visible light at room temperature. Journal of Alloys Compound. 2015; 645: 17-23.
- Lopez R, Gomez R. Band-gap energy estimation from diffuse reflectance measurements on sol-gel and commercial TiO2: a comparative study. Journal of Sol-Gel Science and Technology. 2012; 61: 1-7.
- Magesh G, Viswanathan B, Viswanath RP, Varadarajan TK. Photocatalytic behavior of CeO2-TiO2 system for the degradation of methylene blue. Indian Journal of Chemicals. 2009; 3: 480-488.
- Umezawa N, Shuxin O, Ye J. Theoretical study of high photocatalytic performance of Ag3PO4. Physical Review B. 2011; 83: 035202.
- Dos Santos ML, Lima RC, Riccardi CS, Tranquilin RL, Bueno PR, Varela JA, Longo E. Preparation and characterization of ceria nanospheres by microwave-hydrothermal method. Materials Letters. 2008; 62: 4509-4511.
- Zawadzki M. Preparation and characterization of ceria nanoparticles by microwave-assisted solvothermal process. Journal of Alloys Compounds. 2008; 454: 347-351.
- Khalil KMS, Leena A, Elkabee LA, Murphy B. Preparation and characterization of thermally stable porous ceria aggregates formed via a sol-gel process of ultrasonically dispersed cerium (IV) isopropoxide. Microporous and Mesoporous Materials. 2005; 78: 83-89.
- Yu X, Ye P, Yang L, Yang S, Zhou P, Gao W. Preparation of hexagonal cerium oxide nanoflakes by a surfactant free route and its optical property. Journal of Material Research. 2007; 22: 3006-3013.
- Prekajski M, Fruth V, Andronescu C, Trandafilovic LV, Pantic J, Kremenovic A, Matovic B. Thermal stability of Ce1-xBixO2-d (x = 0.1-0.5) solid solution. Journal of Alloys and Compounds. 2013; 578: 26-31. 2013; 578: 26-31.
- Salimi F, Abdollahifar M, Jafari P, Hidaryan M. A new approach to synthesis and growth of AlOOH nanocrystalline with high pore volume. Journal of Serbia Chemical Society. 2007; 82: 1-11.
- Ho C, Yu JC, Kwong T, Mak AC, Lai S. Morphology controllable synthesis of mesoporous CeO2 nano and microstructures. Chemical Materials. 2005; 17: 4514-4522.
- Lefebvre J, Austing DG, Bond J, Finnie P. Photoluminescence imaging of suspended single-walled carbon nanotubes. Nano Lett. 2006 Aug;6(8):1603-8. doi: 10.1021/nl060530e. PMID: 16895343.
- Katsumata H, Hayashi T, Taniguchi M, Suzuki T, Kaneco S. Highly efficient visible light driven AgBr/Ag3PO4 hybrid photocatalysts with enhanced photocatalytic activity. Materials Science in Semiconductor Processing. 2014; 25: 68-75.
- Ji P, Zhang J, Chen F, Anpo M. Study of adsorption and degradation of Acid Orange 7 on the surface of CeO2 under visible light irradiation. Applied Catalysis B.2009; 85(3-4): 148-154.
- Geresu G. Polyaniline supported CdS/ZnO/Ag3PO4 nanocomposite: synthesis and characterization for photocatalytic activity and antimicrobial applications. MSc Thesis, Haramaya University, Haramaya, Ethiopia. 2017.
- Zhou P, Le Z, Xie Y, Fang J, Xu J. Studies on facile synthesis and properties of mesoporous CdS/TiO2 composite for photocatalysis applications. Journal of Alloys and Compounds. 2017; 692: 170-177.
- Ren J, Chai Y, Liu Q, Zhang L, Dai WL. Intercorrelated Ag3PO4 nanoparticles decorated with graphic carbon nitride: Enhanced stability and photocatalytic activities for water treatment. Applied Surface Science. 2007; 403: 177-186.
- Wang P, Huang B, Qin X, Zhang X, Dai Y, Wei J, Whangbo MH. Ag@AgCl: a highly efficient and stable photocatalyst active under visible light. Angew Chem Int Ed Engl. 2008;47(41):7931-3. doi: 10.1002/anie.200802483. PMID: 18773395.
- Zhang W, Hu C, Zhai W, Wang Z, Sun Y, Chi F, Ran S, Liu X, Lv Y. Novel Ag3PO4/CeO2 p-n hierarchical heterojunction with enhanced photocatalytic performance. Materials Research. 2006; 19(3): 673-679.
- Fujishima A, Rao TN, Tryk DK. Titanium dioxide photocatalysis. Journal of Photochemistry and Photobiology C: Photochemistry Reviews. 2000; 1(1): 1-21.
- Hidalgo D, Bocchini S, Fontana M, Saraccob G, Hernandez S. Green and low-cost synthesis of PANI-TiO2 nanocomposite mesoporous films for photoelectrochemical water splitting. Royal Society of Chemistry. 2015; 5: 49429-49438.
- Ameen A, Akhtar MS, Kim YS, Yang B, Shin HS. An effective nanocomposite of polyaniline and ZnO: preparation, characterizations, and its photocatalytic activity. Colloid Polymer Sciences. 2011; 289: 415-421.
- Li J, Zhu L, Wu Y, Harima Y, Zhang A, Tang H. Green and low-cost synthesis of PANI/TiO2 nanocomposite mesoporous films for photoelectrochemical water splitting. Polymer. 2006; 47: 7361-7367.