
More Information
Submitted: November 11, 2020 | Approved: February 04, 2021 | Published: February 05, 2021
How to cite this article: Zenebe W, Daniel T, Weyessa G. Characterization and virulence determination of Colletotrichum kahawae isolates from Gidami, Western Ethiopia. J Plant Sci Phytopathol. 2021; 5: 004-013.
DOI: 10.29328/journal.jpsp.1001054
Copyright License: © 2021 Zenebe W, et al. This is an open access article distributed under the Creative Commons Attribution License, which permits unrestricted use, distribution, and reproduction in any medium, provided the original work is properly cited.
Keywords: Incidence; Isolates; Pathogen city test; Prevalence; Severity

Characterization and virulence determination of Colletotrichum kahawae isolates from Gidami, Western Ethiopia
Zenebe W1*, Daniel T2 and Weyessa G2
1Ethiopian Institute of Agricultural Research, Jimma, Ethiopia
2Jimma University College of Agriculture and Veterinary Medicine, P.O.B. 307, Jimma, Ethiopia
*Address for Correspondence: Zenebe W, Ethiopian Institute of Agricultural Research, Tel: +251-116454452/454413; Fax +251-116461294; Email: [email protected]; [email protected]
Coffee is one of the most essential crops that generate income for Ethiopian economic growth. However, its production faced with many factors primarily biotic entities. Among these, the fungal pathogen /Colletotrichum kahawae/ that induce coffee berry disease (CBD) is the main constraint of coffee production in the country. The pathogen is a very specialized and infects the green berries/fiscal par/which diminishes the income gained from it and disturbs the country’s economy in general and the producers in particular. Regarding to the disease level and related factors, little information is available in Western Ethiopia. Hence, this study was initiated to assess the magnitude of CBD in coffee fields, to characterize and evaluate the virulence of C. kahawae isolates from the study areas of Gidami district. Assessment was done in 9 selected kebeles of 45 total farms starting from July 2017. The results indicated that CBD was prevalence in all assessed areas with the range of 66% to 86% and 16% to 50% disease incidence and severity index (SI), respectively. The highest CBD intensity was observed in higher altitude with a significant positive correlation between disease incidence (r = 0.61) and severity (r = 0.55). Macro and microscopic characterization results revealed isolates diversity in terms of colony color, density, mycelia growth rate and conidial production. Moreover, mycelia growth rate differs significantly (p < 0.001) in the range between 2.2 to 4.3 mm/24 hrs. Similarly, the sporulation capacity widely ranged from 186.1 to 572.3 spores/ml. This were strongly agreed with the virulence test that revealed significant variation (p < 0.001) among isolates and infection percentage also ranged between 34.8% and 88.7%. In all, the study was not only showed the CBD is very important disease of coffee in the study area but also determines the virulence disparity among isolates. To be honest, the diversity/identity of C. kahawae isolates should be confirmed using more other reliable methods thru including additional sample areas as well.
Coffee (Coffee arabica L.) is the vital sources of hard currency that serves as means of livelihood for millions of individuals in Africa, Asia and Latin America. It has a significant economic, social and spiritual impact with diverse cultural and psychological futures [1-3]. Today, it has grown in more than 80 countries within more than 10 million hectares of land [4]. Besides, Ethiopia is the primary center of origin and diversity of Arabica coffee which ranks 1st and 5th in Africa and the world respectively [5].
The existence of ideal and diverse agroecologies together with opportunistic production systems (forest, semi forest, garden, and plantations) in Ethiopia made coffee to be the leading agricultural produce in the country [6]. The crop is largely cultivated in the Southern, South Western, Western and Eastern parts of Ethiopia [7] thru 700,447 ha of total land coverage and 469, 091 tons of production per annum [8]. From all these, Oromiya Regional State covers the largest share of coffee cultivation with more than 464,426 ha (66%) of total area coverage and 317,316 tons of production per annum together with the existence of wider wild coffee trees in large [8]. Following to Jimma zone, West Wollega covers the highest coffee land (about 90,626 ha) through great contribution for the national export market [8,9]. Hence, the presence of the highest heterogeneous germplasm at Gidami district (in the Western part) has been given the highest priority for local landrace development program that encourage the current coffee production prestige.
Though coffee plays a vital role for Ethiopian economy and the producers, its production has been influenced with several biotic and a biotic factors. Colletotrichum species have been reported as the most common constrictions affecting several crops [10,11]. Among these, coffee berry disease (Colletotrichum kahawae), coffee wilt disease (Gibberella xylarioides) and coffee leaf rust (Hemileia vastatrix) that attack fruits, leaves, stems and roots, respectively have been reported as serious challenges of coffee production in tropical and subtropical areas including Ethiopia [12,13].
C. kahawae [14] that causes CBD is an aggressive and specialized fungal pathogen affects coffee production with great damage on the economic parts of green coffee berries [15,16]. For the 1st time, the disease was recorded from Kenya in 1922 and later dispersed to Angola, Cameroon, Malawi, Ethiopia, Tanzania and Uganda within a short time [17-19]. The impact of the disease is varying from place to place and season to season. Likewise depending on the management practices under taken, the rain fall pattern and altitude, the loss due to CBD is also vary on individual farms/could reach up to 100%/under conditions where no control measures are undertaken [20].
According to different research reports, the impacts of CBD is fluctuating among coffee growing provinces of the country/Ethiopia. For instance, 38.8 and 17.2% of mean incidence have been reported in Oromiya and Southern Nation Nationality and People (SNNP) respectively [21]. Recently, Alemu, et al. [16] stated that all coffee producing parts of Ethiopia such as Borena (10% - 80%), Gedio and Hararghe (40% - 100%), Illubabor (10% - 90%) Jimma and Sidama (30% - 90%) suffered with CBD. In Western Wollega, Jirata and Asefa [22] and Alemu, et al. [16] reported 22 and 30% - 80% incidence respectively, indicating the very significance of the disease that can cause complete yield losses wherever susceptible landraces are cultivated [23]. Similar authors Alemu, et al. [16] reported 52.5 and 29.9% of a national average CBD incidence and severity respectively. Even though some reports on CBD intensity are available from the study area /Gidami, its distribution and impacts in the small scale farms production conditions of this area and pathogen aggressiveness is not well known. So, the current study was conducted to address the following objectives.
➣ To assess the status/extent/of CBD in coffee fields fromGidami, Western Ethiopia
➣ To isolate, characterize and pathogenicity study of C. kahawae isolates collected from the study areas
Description of the study areas
The present study was contained field survey, laboratory and greenhouse experiments. Disease assessment was conducted at farmers’ fields of Gidami district (Figure 1) found in Western Wollega zone of Oromiya Regional State. It has located around 08696o N and 34.782o E of latitude and longitude coordinates respectively on 1844 m.a.s.l, elevation. It receives 1750 mm of mean annual rainfall and 25oC of mean annual temperature. On the other hand, isolation, characterization and evaluation of pathogenic variability among C. kahawae isolates were conducted at Jimma Agricultural Research Center (JARC).
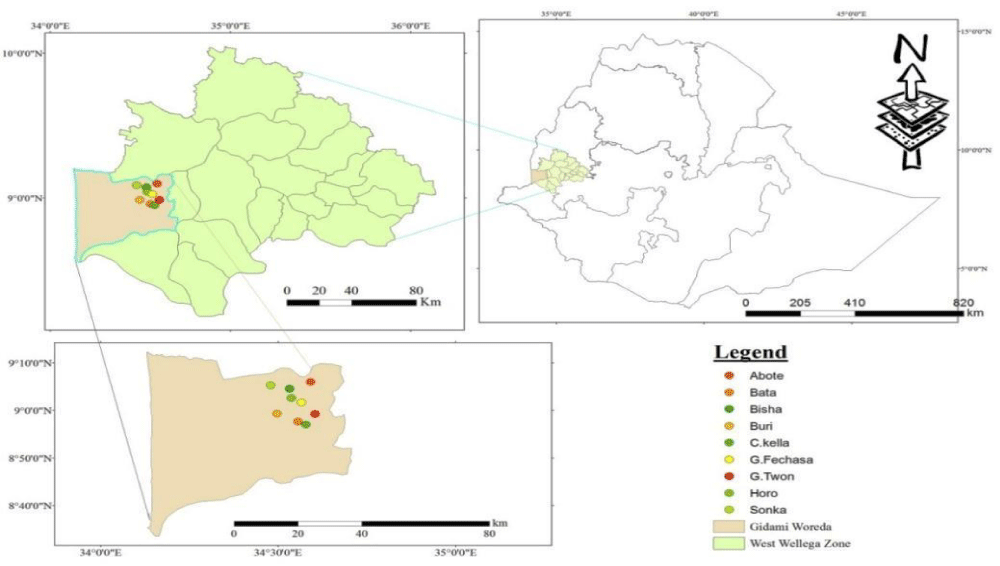
Figure 1: Allocation of the study sites on map.
Assessment was done starting from July 2017 cropping year. Based on coffee production potentials and altitude variation, 9 Kebeles were selected from the district and total of 45 farms (5 farms from each kebele) were selected purposively. Then, CBD was recorded from the total plants on berries using the procedure adopted by Mohammed and Jambo [24]. To monitor the absence or presence of CBD symptoms such as scab and dark sunken lesions on berries, ten trees were selected randomly by diagonal fashion in 6-8 m interval. Afterwards, disease presence was computed by the following formula:
F1
Also, disease severity was assessed on the same plants selected for disease incidence after selecting 3 branches from 3 strata (top, middle and bottom) from each tree using 0-6 disease score scale (Table 1) [25]. Hence, percent severity index (PSI) was computed as;
F2
| Table1: Disease severity assessment scales used to adopt by Mohammed & Jambo [25]. | |
| Disease index | Descriptions |
| 0 | Healthy green berries without symptoms |
| 1 | Black sunken lesions cover < 2% of the green berries surface |
| 2 | Black sunken lesions cover 2% - 5% of the berries surface ~3 mm in diameter |
| 3 | Black sunken lesions cover 6% - 10% on the berries surface ~5 mm in diameter |
| 4 | Black sunken lesions cover 11% - 50% the berries surface ~7 mm in diameter |
| 5 | Black sunken lesions cover 51% - 99% of the berries surface ~15 mm in diameter |
| 6 | > 99% or the whole surface of berries covered with black sunken lesions; mummified berries |
Furthermore, disease prevalence was estimated as the number of infected fields over total number of fields assessed. Basic information like production system, shade types altitude and the 2dary information such as age the tree, types of varieties cultivated and disease management practices were taken using smart GPS instrument and simple questionnaires correspondingly.
Sample collection, isolation and identification
For this study, 30 green coffee berries samples containing active and black sunken lesions were taken from each farm (where available). Then, samples were placed in a plastic bag and kept in cool ice box and transported to JARC plant pathology laboratory, reserved in deep freezer at18-20 oC [26] until further isolation.
Virulence determination of the isolates on detached berries
To determine the level of virulence in C. kahawae isolates collected from the study areas, detached berry test (DBT) technique described by Zeru and Kamau [25,27] were used. The total of 15 isolates including the standard isolate from Gera and 370 which was identified as laboratorial susceptible variety for C. kahawae previously was used for this activity. Initially were used for this activity and fully expanded healthy green coffee berries were collected from matured coffee trees selected on the basis of green berry maturity i.e. 14 to 15 weeks after flowering [25,26], sterilized with 5% sodium hypochlorite solution and rinsed three times with sterilized distilled water then dried using sterile cotton cloth and arranged into a plastic box lined with tissue paper. Finally, the experiment was laid out in CRD design with 3 replications containing 6 berries per replication (Figure 2).
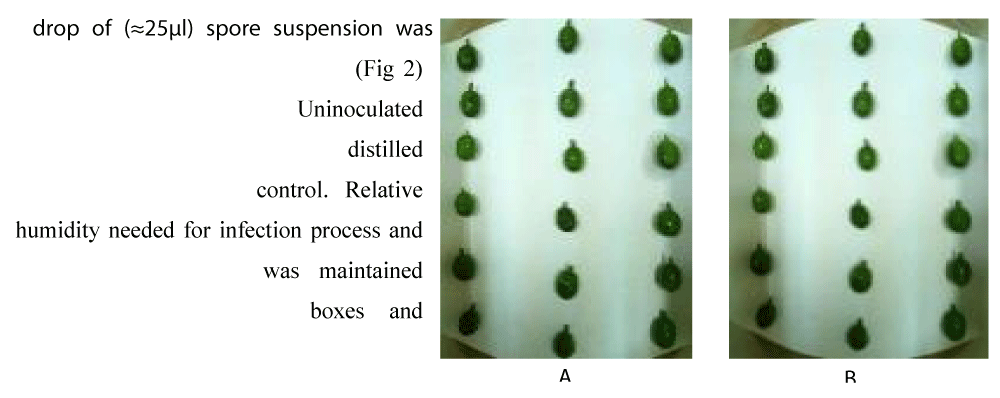
Figure 2: Detached green coffee berries inoculated with Colletotrichum kahawae spore suspension (A) and the control sprayed with water (B).
Inoculum preparation and inoculation
Conidial suspension of each isolate was prepared from 10 days old culture (Figure 5) using similar procedure used for characterization. Haemocytometer was used to determine spore concentration adjusted with 2 x 10⁶/ml Adrop of (≈ 25 µl) spore suspension was placed at the center of each berry (Figure 2) using micropipette. While, Uninoculated boxes sprayed with sterilized distilled water and used as a control. Relative humidity needed for infection process and symptom development was maintained thru tightly closing the boxes and incubated at 25 oC up to 14 days.
Data collection and statistical analysis
Data was collected three times starting from 7th day after inoculation i.e. when the 1st CBD symptoms appeared [28] and disease incidence was computed based on the ration of infected to total healthy berries treated. While, disease severity was determined as proportion of necrotic area using 0-6 disease scale. The average infection percentage (AIP) was calculated as;
F3
Where, I sum of disease score, r replication and N total number of berries in the replication [25].
All the data i.e. incidence, severity, isolates macro and microscopic characteristics, disease data from virulence determination studies were analyzed using one-way ANOVA via SAS version 9.3 software. Mean separation was compared using Duncan Multiple Range Test (DMRT). Normal distribution test was undertaken before the analysis of variance [29]. The relationship between disease variables, altitudes and pathogen characteristics were determined by Pearson (product-moment) correlation analysis by SAS software (Proc procedure).
Disease intensity/incidence and severity
The results from the survey revealed that CBD was prevalent in all assessed fields of Gidame district (i.e.100%) with significant difference (p < 0.05) among kebeles. It was observed that the level of CBD incidence give rise to 86.0% at Chomen Kela kebele which is relatively the highest in magnitude but not different significantly from others (Bata, Buri, Geba Fechasa, Gidame Town and Gray Sonka) kebeles statistically. While, CBD incidence at two kebeles i.e. at Gray Horo and Gray Bisha indicated relatively low (66.0% and 68.0%) respectively but not vary statistically from Abote, Gray Sonka and Geba Fechasa Kebeles. Here, the overall DI ranged between 66.0% to 86.0% with an average incidence of 76.0% (Table 2).
| Table 2: The magnitude of disease intensity from assessed kebeles of Gidami district. | ||
| Kebele | DI | PSI |
| Gray Horo | 66.0c | 19.7c |
| Gray Sonka | 74.0abc | 32.0b |
| Gidame Town | 74.0abc | 34.3b |
| Abote | 70.0bc | 36.3ab |
| GebaFechasa | 78.0abc | 39.7ab |
| Gray Bisha | 68.0c | 41.0ab |
| Chomen Kela | 86.0a | 42.0ab |
| Buri | 84.0ab | 48.9a |
| Bata | 84.0ab | 49.7a |
| Mean | 76.0 | 38.2 |
| CV (%) | 14.1 | 24.7 |
| Means with the same letters are not differing significantly (DMRT; 14.2-16.1 of DI and 12.9-14.7 of PSI at p < 0.05 and p < 0.01). The mean values are obtained from the sum of five farms. The CV value is gained after data transformation. | ||
Likewise, the result of analysis of variance indicated highly significant difference (p < 0.001) in percent disease severity index (PSI) among kebeles within 19.7% to 49.7% range. The highest PSI record was from Buri (49.7%) and Bata (49.0%) kebeles with not statically difference from Chomen Kela, Gray Bisha, Geba Fechasa and Abote kebeles. On the other hand, the lowest (19.7%) PSI recorded from Gray Horo Kebele. The average CBD PSI “38.2% and > 39%” was recorded from Buri, Bata, Chomen Kela, Gray Bisha and Geba Fechasa kebeles (Table 2). Hence, disease severity percentage indicated the relevant host tissue infection covered by disease symptoms (Aswan et al, 2016) which directly correlated with the damage caused on coffee farms due to CBD but disease incidence tells us the presence or absence of the disease in the observation fields.
Means with the same letters are not differing significantly (DMRT; 14.2-16.1 of DI and 12.9-14.7 of PSI at p < 0.05 and p < 0.01). The mean values are obtained from the sum of five farms. The CV value is gained after data transformation.
Besides, issues like the use of local coffee cultivars (genetically susceptible with low yield), management practices (hand ploughing, slashing etc.) and altitude difference can be considered as initiating factors for disease development. Here, the presence of susceptible coffee landraces is conducive for CBD epidemic advance that influence coffee production and leads to reduction in yield and the income of the farmers in particular and for the country in general [30,31]. In addition to this, the current climate change contributes a lot for the pathogen that suffers the coffee potential especially on previously released good yielding and resistant varieties [16,32].
Association between CBD intensity and altitude
Pearson correlation analysis between disease intensity (DI and PSI) and altitude showed highly significant (p < 0.001) and strong positive correlation (r = 0.61) and PSI (r = 0.55) respectively (Table 3).
| Table 3: Correlation analysis between major factors and disease intensity. | ||||
| Variables | DI | PSI | Alt | CPS |
| PSI | 0.78** | |||
| Alt | 0.61** | 0.55** | ||
| CPS | 0.31* | 0.29* | -0.35 | |
| Age | 0.46* | 0.36* | - 0.23 | -0.24* |
| DI: Disease Incidence; PSI: Percent Severity Index; CPS: Coffee Production System. *and **significant level at p < 0.05 and p < 0.01respectively. | ||||
As indicated on the graph (Figure 3) disease intensity (DI and PSI) increase across altitude. The highest disease incidence (90%) and severity index (50.3%) was recorded from high altitude range i.e. 1879-1989 m.a.s.l.
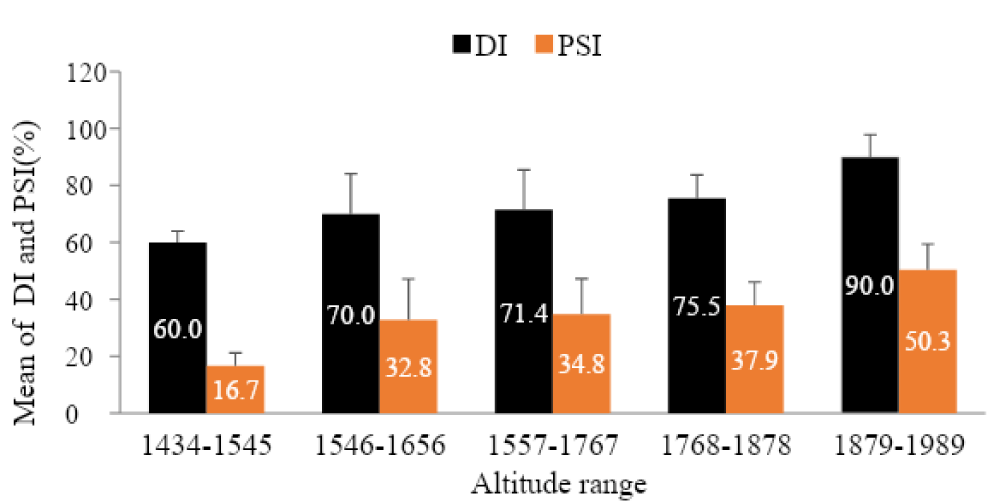
Figure 3: Incidence and Severity of coffee berry disease across different altitude ranges.
This result in agreement with the findings made by Bedimo, et al., Zeru, et al. [33,34], Alemu, et al., Reuben and Kagezi, et al. [16,35] as they have stated that the highest influence of CBD is common in the place where high altitude (with favorable environmental conditions), low temperature, high moisture and susceptible hosts have existed together. Also, the evidence (the existence of high CBD severity and incidence) at Gidami district is a very important and gives deep insight about the importance of the disease in the Western coffee producing areas particularly in the district. Though, Jirata and Asefa [22] and recently Alemu, et al. [16] have reported 22% and 30% - 80% severity and incidence from Western Wollega zone (Gimbi and Haru districts) respectively and 66% - 86% in this study, indicating the increment. This denotes that the disease can cause up to complete yield loss in the areas where cultivated with susceptible landraces with no adequate control measures [23].
Susceptibility variations in coffee cultivars to CBD were observed after its first outbreak (before 5 decades ago) and spread from infected to the new areas easily which is the great challenge especially in high altitude areas including the mid land today [36,37]. Again, this study provides valuable input for designing short and/or long term management strategies such as selection of resistant lines adapt to various ecological conditions as well. Despite the great effort that has been undertaken to replace the CBD susceptible coffee cultivars with resistance and better yielding ones, the old coffee trees still cover the large areas (> 80%) of Ethiopian coffee cultivation [4,16]. This infers that the situation could offer a good opportunity for early dissemination of the pathogen to the wider areas [17,18]. The critical message of this study is that CBD epidemic development is a great risk of Ethiopian’s coffee production especially in the small-scale farms. Therefore, lessening of its influence via creating strong collaboration among different research teams and stake holders sets a significant role by improving the sector from plantation towards commercialization and export of the commodity as well.
Relationship between coffee production system and disease intensity
The survey result showed that there was weak positive correlation between coffee production systems and incidence (r = 0.31) and severity (r = 0.29) of CBD (Table 6). The relationship revealed that the disease intensity (DI and PSI) become slightly strong in the garden followed by semi-forest production systems (Figure 4).
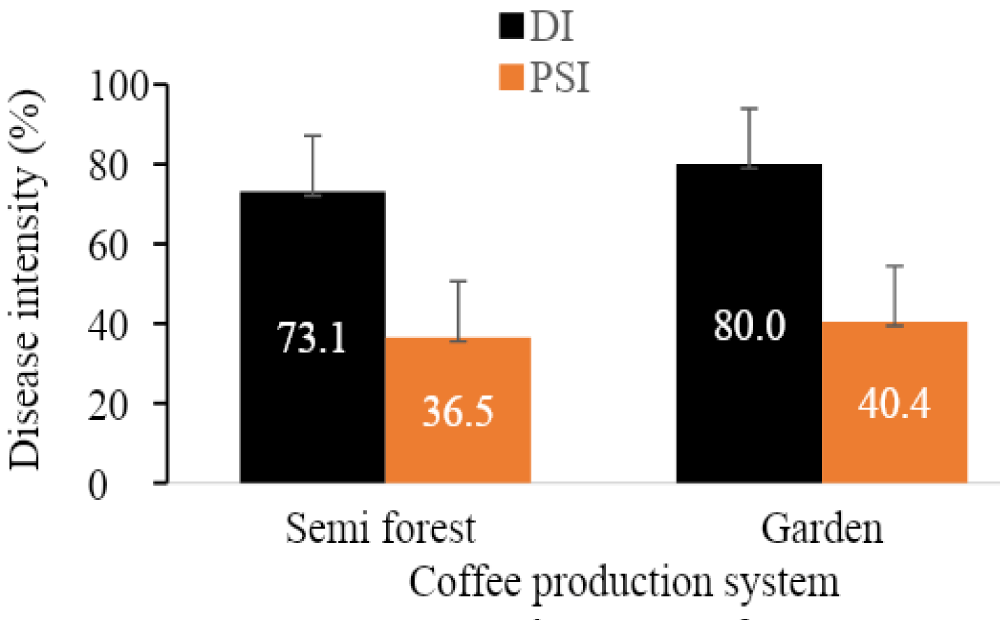
Figure 4: Intensity of coffee berry disease among production systems across the study areas. The bars in dictate standard deviation.
About 80.0% of DI and 40.4% PSI was recorded from garden production system whereas 73.1% DI and 36.5% from semi-forest. Clear variation between garden and semifrorest production systems could be associated with different factors. For instance, in the garden production system contains homogenous coffee populations and frequent human interference (management strategies, cropping type, etc.) and lead to increase the disease level. While, the availability of heterogeneous population’s with low inputs and low human intervention in the semi-forest can reduce disease epidemics and its impact. Bieysse, et al. [38] described that frequent human interference hastened the spatial and temporal dispersal of the disease.
Also, shade difference can alter disease distribution and magnitude among production systems. In the garden system, majority of coffee trees appeared with or without shade can show high disease level. While, coffee trees are self-grown in semi-forest production systems containing natural forest cover with little human interference that serve as a shade [39]. In relation to high disease pressure, Vaast, et al, Bedimo, et al. and Kebati, et al. [36,40,41] reported shade can creates microclimatic conditions that help to delay fruit ripening and lead to a shift in the period of berry susceptibility. According to Bedimo, et al. [33] report shade can change certain rainfall characteristics and has an influence on conidial dispersal. The plant canopies might intercept certain rain drops and divert their route or reduce the speed of those droplets that can reach directly to the coffee trees [42]. In the same way, Alemu, et al. [16] stated that CBD intensity is high intensity in the garden production followed by semifrorest and forest production systems in different coffee growing areas of Ethiopia.
Macroscopic characterization of C. kahawae isolates
Based on visual observation of the culture plats, 46.6%, scarce, 33.3% dense and 20% very scarce colony types appearance (mycelial growth) of the isolates were identified. The colony colors were also varied at both sides of the cultured plates (Figure 5). On the other hand, 20% of dark gray, light gray and white gray of each colony colors and 13.3% of floral white, lavender and old lace of each colony colors were observed at the front side. While, most of the isolates reflected Navajo white and light golden rod colony color (26.6% of each) followed by 20.0%, 13.1 and 13.1% of light gray, medium violet and dark olive green colony colors were observed from the back sides of the culture plate respectively (Table 4). Generally, most the isolates showed whitish mycelial color up to the first 4-6 incubation days and changed into light gray colony colors week after incubation on PDA. Biratu, Zeru, et al. and Emana [7,43,44] also reported the existence of cultural variation of C. kahawae isolates from samples collected from Kaffa, Illubabor and Hararghe, respectively.
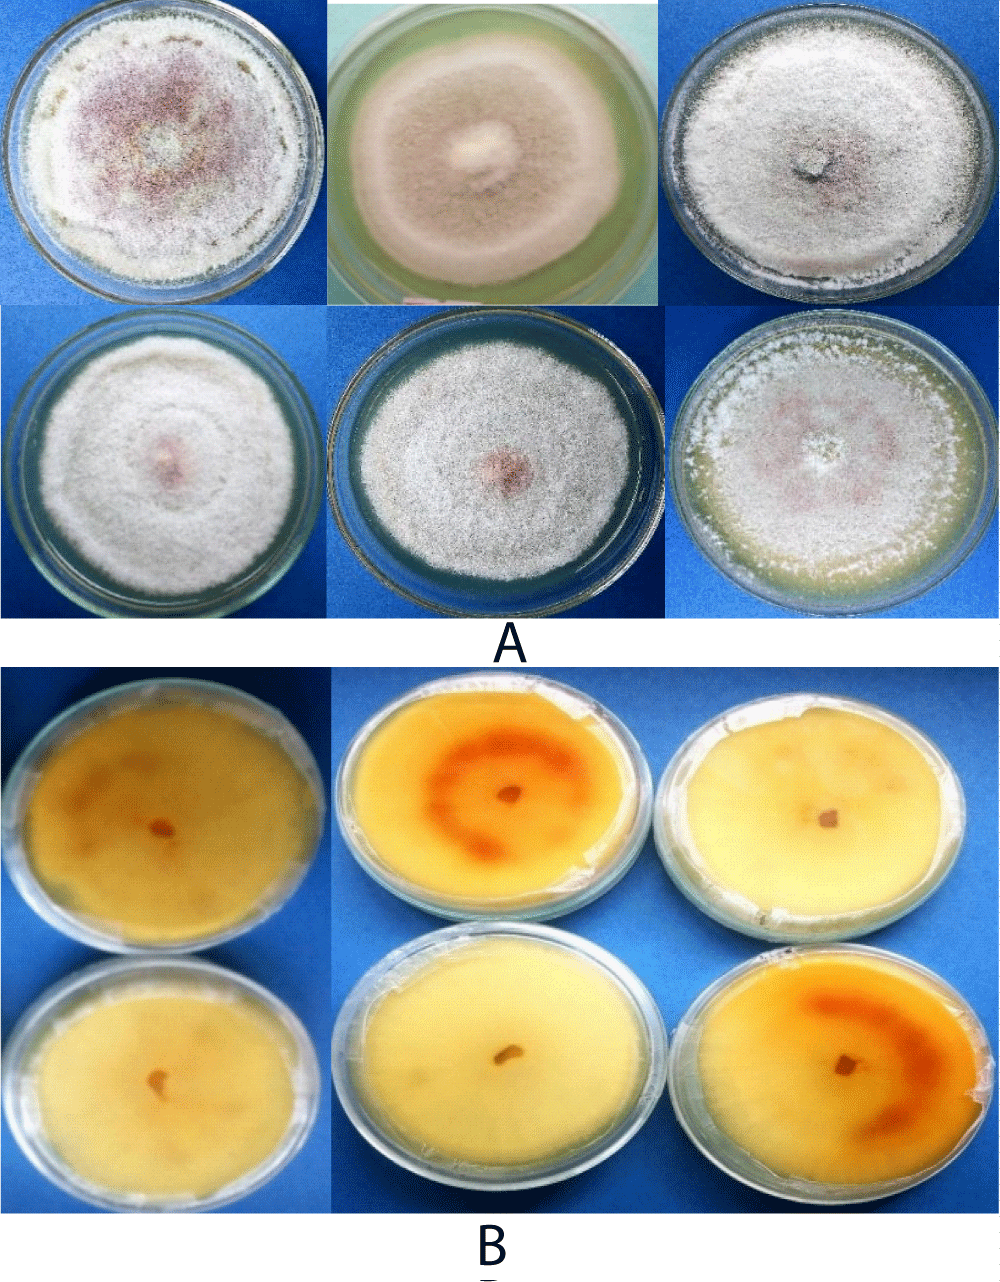
Figure 5: Ten days culture pigmentations of Colletotrichum kahawae isolates, (A) front and (B) revers sides on PDA media.
| Table 4: Macroscopic characteristics of Colletotrichum kahawae isolates from study areas. | ||||
| Isolate Code | Colony aspects | Colony color | Colony Growth (mm/day) |
|
| Front | Back | |||
| GF1 | Scarce | White gray | Navajo white | 3.5cde |
| BA | Dense | Dark gray | Light Gray | 4.1ab |
| AB2 | Very scarce | Lavender | Light gay | 2.6ghi |
| GC | Dense | Dark gray | Light gray | 4.3a |
| GS | Very scarce | Lavender | Medium violet red | 2.2i |
| BU2 | Dense | Old lace | Light golden rod | 3.8fgh |
| CK2 | Scarce | Light gay | Light golden rod | 3.2efg |
| GB1 | Scarce | white Gray | Navajo white | 3.8a-d |
| GF3 | Very scarce | Floral white | Navajo white | 2.5hi |
| GH | Scarce | Dark gray | Dark olive green | 3.3def |
| GT | Scarce | Old lace | Medium violet red | 3.5b-e |
| GB4 | Scarce | Light gray | Light golden rod | 3.3def |
| AB5 | Scarce | Light gray | Light golden rod | 3.3def |
| AB1 | Dense | Floral white | Navajo white | 4.0abc |
| Ck1 | Dense | White gray | Dark olive-green | 4.15a |
| Mean CV (%) |
. | 3.4 9.1 |
||
| Means followed with the same letters are not significantly different (DMRT; 0.5-0.6 at p < 0.05). The reference Gera isolate showed in bold. The letters in the isolates code refers to the first two letters of the name of the kebele and the number indicates the farm’s number where the isolates are collected. | ||||
On the other hand, the result in mycelial growth showed a highly significant difference (p < 0.001) among the isolates. The overall mean radial mycelial growth rate ranged from 2.2- 4.3 mm/day. The isolate from Gera (GC) showed 4.3 mm/day radial growth rate which is the fastest from CK1, BA, AB1 and GB1isolates but not differ significantly. Whereas, the slowest mean radial growth rate 2.2 mm/day was from isolate GS followed by GF3 and AB2 isolates which did not significantly differ from GS (Table 4). In line with this result, Biratu and Hulluka [45] variations in radial mycelial growth of C. kahawae isolates with an average growth rate of 6.5 and 6.7 mm/24 hrs have been reported on PDA. The result of present study however, closerto that of Zeru [27] which was 4.4 mm/ 24 hrs.
Cultural characters have a fine taxonomic measure in identification of fungal species [46]. C. kahawae isolates associated with coffee differs in mycelial growth, colony characters and growth rates from other Colletotrichum isolates which is important feature for grouping them into separate class depending on visual observation from the culture plates [47]. Kebati, et al. [36] stated that conidial morphology has always been emphasized over other taxonomic criteria in taxonomic investigations of the genus Colletotrichum. However, distinguishing Colletotrichum species culturally is difficult that needs experience and critical observation or identification tools because some species like C. gloesporioides and C. acutatum found associated in coffee have related very closely to C. kahawae isolates [48].
As C. kahawae species are known with slow mycelial growth rate on culture medium in nature, this can be the distinguishing criterion from others and could serves as indicator of variability within the species [49]. Also, C. kahawae has consistent characteristics among isolates across its range of distribution and commonly found associated with coffee [37,50]. The nature of infection and its uniqueness to occupy ecological niche towards development on green berries is also the key distinguishing features of the pathogen from all other Colletotrichum species [7,51].
Microscopic characterization
The result in microscopic characterization showed highly significant variations (p < 0.001) in conidial size among isolates (Figure 6). In comparison to conidial width, variability was more in conidial length of the isolates. The ratio (conidial variability of each isolate per ml) of the shortest isolates GH, GF3, Ck2 and GC of the length conidial to the longest isolate GB2 was 1: 6. GB2 isolate showed the largest conidial length (5.9 µm) and width (3.0 µm). The ratio of the narrowest (isolate BA and GB4) conidial width to the broadest isolate GB2) were about 1:5. In fact, conidial size of most isolates was in the range of 3.8-5.9 µm length and 2.0-3.0 µm width (Table 5).
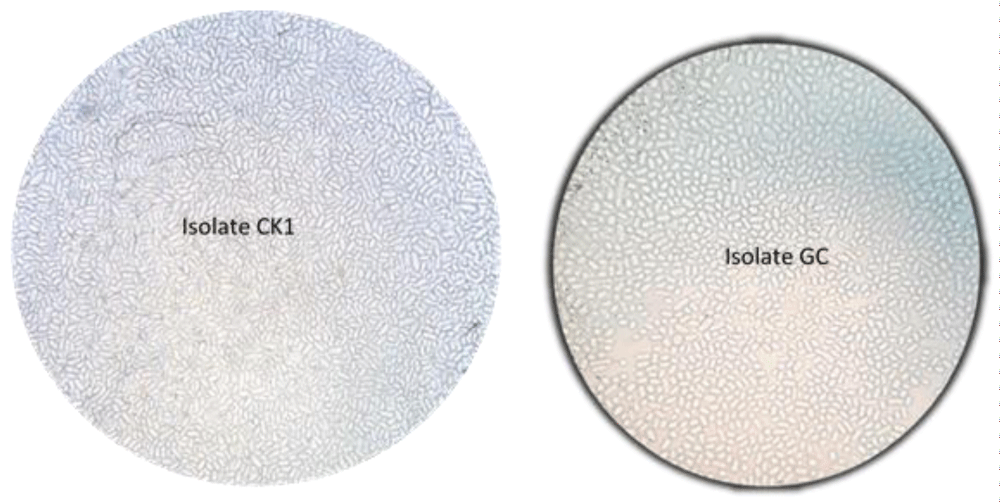
Figure 6: Ten days culture pigmentations of Colletotrichum kahawae isolates, (A) front and (B) revers sides on PDA media.
| Table 5: Microscopic characteristics of Colletotrichum kahawae isolate from the study areas. | ||||
| Isolate Code |
Collection site | Conidial production | Conidial size(µm) | |
| (Kebeles) | (x10,000) | Length | Width | |
| GF1 | Geba Fechasa | 344.9e | 3.9def | 2.1def |
| BA | Bata | 440.7cb | 4.3d | 2.0g |
| AB2 | Abote | 219.6gh | 4.2cb | 2.2cde |
| GC | Gera | 572.3a | 3.8ef | 2.2cde |
| GS | Gray Sonka | 186.1h | 4.1b-e | 2.2cde |
| BU | Buri | 382.5ced | 4.0b-e | 2.1c-f |
| CK2 | Chomen kela | 261.3defg | 3.8ef | 2.1c-f |
| GB2 | Gray Bisha | 373.0de | 5.9a | 3.0a |
| GF3 | Geba Fechasa | 200.0gh | 3.8ef | 2.3b |
| GH | Gray Horo | 327.7ef | 3.8ef | 2.1ef |
| GT | Gidame Town | 364.6de | 3.9def | 2.2cde |
| GB4 | Gray Bisha | 340.3e | 4.0b-f | 2.0g |
| AB5 | Abote | 330.3e | 3.9def | 2.2cde |
| AB1 | Abote | 430.0bcd | 4.1bcd | 2.1def |
| Ck1 | Chomen kela | 459.3b | 3.9def | 2.3b |
| Mean CV (%) |
348.8 11.5 |
4.1 3.5 |
2.2 2.5 |
|
| Data shown mean values of 15 measurements. Means with the same letter are not statistically different (DMRT; 67.6 - 80.3 of sporulation, 0.25-.29 of conidial length and 0.09-0.12 of conidial width at p < 0.05). Results of the standard isolate GC is shown in bold. | ||||
The other microscopic description parameter considered in this study was sporulation capacity. It revealed that except GS, all isolates produced abundant conidia with highly significant differences (p < 0.001) among each other. The variation in the number of conidia production ranged from 186.1 to 572.3 per ml. Hence, the highest conidial number (572.3 conidia/ml) was produced by the standard isolate (GC) from Gera followed by isolate Ck1 (459.1 conidia/ml). Whereas, the least and the intermediate numbers of conidia was produced by GS and GB4 isolates (Table 5). This result was in agreement with Derso and Waller, Zeru, and Prihastuti, et al. [12,27,48] that they have noticed conidial morphology is important distinguishing features of C. kahawae isolates from other Colletotrichum species and its sporulation potential can vary among isolates.
Determination of virulence in C. kahawae isolates
The result in the virulent test revealed that all isolates were pathogenic to the variety 370 with significant (p < 0.001) variations in the level of aggressiveness. Interestingly, the highest level of infection (88.7%) was recorded from the standard isolate/GC followed by CK1, AB1, BA, CK2 and BU isolates which were not differed statistically. On the other hand, the least infection percentage (34.8%) was from GS isolate followed by GF3, AB2, GH, AB5, GB4, GF1, GT and GB2 which caused significantly the lowest level of infection percentage compared to the standard isolate (Table 6).
| Table 6: Virulence of Colletotrichum kahawae isolates on susceptible 370 variety as determined by detached berry test. | |
| Isolates | Infection percentage |
| GS | 34.8d |
| GF3 | 37.5cd |
| AB2 | 42.1cd |
| GH | 44.9cd |
| AB5 | 45.7cd |
| GB4 | 48.4cd |
| GF1 | 50.3cd |
| GT | 58.7bcd |
| GB2 | 60.4bcd |
| BU | 61.4a-d |
| CK2 | 63.9abc |
| BA | 65.0abc |
| AB1 | 78.6ab |
| CK1 | 83.1ab |
| GC | 88.7a |
| Control | 0.0e |
| Mean CV (%) |
54.0 16.9 |
| Isolates are sorted according to increasing level of aggressiveness. Means with the same letter are not statistically different (DMRT; 24.8-29.6 at p < 0.05). The most aggressive reference isolate from Gera is marked in bold. | |
In the present study, the symptoms produced by the pathogen on artificial inoculation/on the detached berries/showed similar symptoms observed under natural infection at field. It is true that susceptible genotypes allow the expression of clear differences in aggressiveness when exposed to different pathogens [31]. Chen, et al. [52] described that unlike other Colletotrichum species such as C. gloesporioides not often infect coffee berries except at berry maturity stage (red berries), C. kahawae causes distinct symptoms (like deep sunken lesions on the green berry surface) that invade the whole berry surface and destroy it completely.
Depending on mutual effect of host susceptibility, pathogen aggressiveness and favorable climatic conditions, the occurrence and intensity of CBD varies from place to place and season to season [43]. From the pathogen perspective, there might be variations in growth rate and production of physical structures and chemical secretions involved in host-attachment and penetration. Kamau [25] have described that conidia of C. kahawae pathogen germinate and differentiate into melanized aspersoria both “in vitro” and “in vivo” and penetrate different coffee organs (hypocotyls, leaves and young green berries).
Pathogen city tests on detached green coffee berries enables to separate C. kahawae from other Colletotrichum species. These conditions should constitute as the basis for further studies to confirm the ability of detached berry technique to mimic field interaction and therefore it’s potential to contribute to a better understanding of the CBD epidemiology. The aggressiveness of the pathogen can be considered as quantitative measure of the level of the disease reached over time. This indicates that the most aggressive pathogen reached at a specific disease level faster than the less aggressive one. The situation can be measured via latent period, spore production, infection, lesion size and disease severity [51]. Derso and Waller [12] stated that the DBT technique can be used to compare the aggressiveness of several strains of C. kahawae from the same or different geographic origins. Despite the fact that isolates collected from different geographical locations may show similar symptoms on the inoculated genotypes, significant variations might exist in their pathogenicity, aggressiveness and other characteristics such as mycelial growth rate and conidial production [53]. Agreed with this result, Kamau [25] reported considerable pathogenic variability among C. kahawae isolates that are collected from Kenya on detached green berries.
Association of morphological characteristics with pathogenicity
Pearson correlation analysis revealed highly significant (p < 0.001) and strong positive correlation of isolates virulence with the mycelial growth rate (r = 0.96) and sporulation capacity (r = 0.95) of C. kahawae isolates. In contrast, conidial size (conidial length and width) showed non-significant correlation with the virulence of the isolates (Table 7), suggesting that unlike the size of the fungal fruiting structures, faster mycelial growth rate and high sporulation capacity might contribute to the aggressiveness of C. kahawae isolates in C. arabica. Kilambo, et al. [54] recently studied the effect of C. kahawae strains on arabica coffee varieties in Tanzanian and stated that conidial size of C. kahawae spp. has no contribution for pathogenicity of the isolates.
| Table 7: Relationship between morphological characteristics and pathogenicity of Colletotrichum kahawae isolates. | ||
| Variables | Pathogenicity | p - value |
| Growth rate | 0.96** | 0.001 |
| Sporulation capacity | 0.95** | 0.001 |
| Conidial length | 0.21 | 0.15 |
| Conidial width | -0.03 | 0.12 |
The result in correlation analysis revealed differences in sporulation capacity among isolates. Due to the fact that variation in spore density among the Colletotrichum isolates was significant, this can be a useful parameter for characterizing fungal isolates. Besides, fungal isolates with high spore density have been shown to increase the rate of invasion of cell walls of the host plant by Colletotrichum spp. and leads the isolate to be more pathogenic to host [41,55].
Furthermore, the sporulation capacity and growth rate of Colletotrichum isolates may have an important implication in the study of disease epidemiology. Variability in fungal pathogenicity and close relationship between sporulation and virulence can provide a useful information about mass screening of germplasm collections for resistance to the pathogen and subsequent breeding programs for durable resistance by using highly sporulated and virulent fungal isolates Kilambo, et al. [56], this implies that cultural morphology and pathogenic variability could be preliminary parameters for characterizing the fungal isolates [57].
The magnitude of CBD was assessed in nine representative kebeles in Gidami district from Western Wollega zone. The survey result indicated that CBD intensity (incidence and severity) was prevalent in all assessed fields of the district varied among kebeles within the range between 66% to 86% and 16.7% - 49.7% of incidence and PSI, respectively. Besides, the extent of CBD intensity increased when increased in altitude range and revealed positive and strong relationship with incidence (r = 0.61) and PSI (r = 0.51) which also vary among production systems.
Furthermore, total of 15 isolates (14 representatives from the study area and one reference isolate from Gera) were used to study cultural, morphological and pathogenic variation among isolates. All these isolates studied for aerial mycelial growth on PDA and showed 33.3% dense, 46.6% scarce and 20% very scarce type. However, the reference isolate (GC) was the best in the mycelial radial growth within the range between 2.2 to 4.3 mm/day of all isolates. Morphologically, C. kahawae isolates were varied in conidial sizes (ranged 3.8-5.9 µm L ± 2.0-3.0 µm) and sporulation capacity. Significant variations were observed between isolates in conidial production and the highest number of conidia was produced by the reference isolate that ranged from 186.1 to 572.3/ml.
The result in the virulence determination test indicated that all isolates were pathogenic to the detached green coffee berries with varied aggressiveness among isolates with 34.8% - 88.7% range. The result indicated that, the fastest radial growth with high sporulation capacity (r = 0.96) of the isolate may have direct contribution for pathogenicity (r = 0.95) which makes significant and positive correlation to each other. In the virulence study, no isolates exceed than the reference isolates (GC) in aggressiveness under DBT. While, the control (green berries sprayed sterilized distilled water) indicated free of infection i.e. the absence of quicent infection (latent infection) on the green coffee berries that used for the experiment.
Generally, in this study we have tried to assess the extent and relevance the disease/CBD/in the small scale farm level of Gidami district and determine the micro and macroscopic characteristics of the isolates causing CBD. However, regarding the virulence nature of the isolates, further conformation research work should be done via searching of more reliable methods with more surveying by addressing various agroecologies which leads us better recommendation of managing CBD using host resistant.
The authors feel thankful to EIAR and Jimma Agricultural Research Center for allocating finance and facilities during research activities respectively.
- Labouisse JP, Bellachew B, Kotecha S, Bertrand B. Current status of coffee (Coffea arabica L.) genetic resources in Ethiopia: implications for conservation. Genetic Resources and Crop Evolution. 2008; 55: 1079.
- International Trade Center (ITC). The Coffee Exporter's Guide, Third ed, Geneva, (Doctoral dissertation). 2011; 267.
- Chauhan R, Hooda MS, Tanga AA. Coffee: the backbone of Ethiopian economy. 2015; 1: 082-086.
- Etana MB. Review on the Management of Coffee Berry Disease (Colletotrichum kahawae) in Ethiopia. J Food Sci Quality Manag. 2018; 76: 73-76.
- ICO (International coffee organization). Coffee market report in the international trade, challenges and opportunities facing the sector. 2018; 1-8.
- Workafes W, Kassu K. Coffee production systems in Ethiopia. In: Proceedings of the workshop on control of coffee berry disease in Ethiopia; 1999 Aug 13-15, Addis Ababa. 2000; 99-107.
- Emana BT. Distribution assessment and pathogenicity test of coffee berry disease (Colletotrichum kahawae) in Hararghe, Ethiopia. 2015; 2: 038-042.
- CSA (Central Statistical Agency). Area and production of major crops in the Federal democratic republic of Ethiopia central statistical agency agricultural sample survey. 2017; 1: 1-117.
- Mehari B, Redi-Abshiro M, Chandravanshi BS, Combrinck S, McCrindle R. Characterization of the cultivation region of Ethiopian coffee by elemental analysis. Analytical Letters. 2016; 49: 2474-2489.
- Rakotoniriana EF, Scauflaire J, Rabemanantsoa C, Urveg-Ratsimamanga S, Corbusier AM, et al. Colletotrichum gigasporum sp. Nov, a new species of Colletotrichum producing long straight conidia. Mycological Progress. 2013; 12: 403-412.
- Cristobel M, de Jesus Yanez-Morales AL, Solano-Vidal M, Segura-León R, Hernandez-Anguiano AM. Diversity of Colletotrichum species in coffee (Coffea arabica) plantations in Mexico. Eur J Plant Pathol. 2017; 147: 605-614.
- Derso E, Waller JM. Variation among Colletotrichum isolates from diseased coffee berries in Ethiopia. Crop Protection. 2003; 22: 561-565.
- Adugna A, Chemeda J, Arega Z, Tesfaye. Advances in coffee diseases research in Ethiopia. Increasing crop production through improved plant protection. Volume ii proceeding of the 14th annual conference of the plant protection society of Ethiopia. 2009a; 540: 275-303.
- Waller JM, Bridge PD, Black R, Hakiza G. Characterization of the coffee berry disease pathogen, Colletotrichum kahawae sp. Nov. Mycological Res. 1993; 97: 989-994.
- Van der Vossen H, Bertrand B, Charrier A. Next generation variety development for sustainable production of Arabica coffee (Coffea arabica L.): a review. Euphytica. 2015; 204: 243-256.
- Alemu K, Adugna G, Lemessa F, Muleta D. Current status of coffee berry disease (Colletotrichum kahawae Waller & Bridge) in Ethiopia. Arch Phytopathol Plant Protect. 2016; 49: 421-433.
- Hindorf H, Omondi CO. A review of three major fungal diseases of Coffea arabica L. in the rainforests of Ethiopia and progress in breeding for resistance in Kenya. J Advan Res. 2011; 2: 109-120.
- Weir BS, Johnston PR, Dam U. The Colletotrichum gloesporioides species complex. Studies Mycol. 2012; 73:115-180.
- Alemu F. Assessment of the current status of coffee diseases at Gedeo and Sidama zone, Ethiopia. Int J Advan Res. 2012; 1: 192-202.
- Van der Graff. Selection for Arabica coffee types resistant to coffee berry disease in Ethiopia. Mededelingen land Bouwhoge School, Wageningen, Nederland. 1981; 110.
- Zeru A, Assefa F, Adugna G, Hindorf H. Occurrence of fungal diseases of Coffea arabica L. in montane rain forests of Ethiopia. J Appl Botany Food Quality. 2012; 82: 148-151.
- Jirata, Assefa. Status of coffee berry disease in Oromiya region. In: proceedings of the workshop on control of coffee berry Disease (CBD) in Ethiopia, August 13-15 1999, Addis Ababa, Ethiopia. 2000; 9-17.
- Belachew K, Teferi D. Climatic variables and impact of coffee berry diseases (Colletotrichum kahawae) in Ethiopian coffee production. 2015; 5: 55-64.
- Mohammed A, Jambo A. Importance and characterization of coffee berry disease (Colletotrichum kahawae) in Borena and Guji Zones, Southern Ethiopia. J Plant Pathol Microbiol. 2015; 6: 1-6.
- Kamau APK. Characterization of coffee genotypes derived from crossing Rume Sudan and SL 28 coffee varieties against coffee berry disease (CBD) causal pathogen (Colletotrichum kahawae). 2015; 1-61.
- Kilambo DL. Virulence of Colletotrichum kahawae strains and their effect on resistant Arabica coffee varieties in Tanzania (Doctoral dissertation, Sokoine University of Agriculture). 2008; 1-79.
- Zeru A. Diversity of Arabica coffee populations in Afromontane rainforests of Ethiopia in relation to Colletotrichum kahawae and Gibberella xylarioides. 2006; 1-68.
- Pinard F, Omondi CO, Cilas C. Detached berries inoculation for characterization of coffee resistance to coffee berry disease. J Plant Pathol. 2012; 94: 517-523.
- Gomez KA, Gomez AA. Statistical procedures for agricultural research, second edition John Wiley and Sons Inc, New York. 1984; 680.
- Benti T. Progress in Arabica coffee breeding in Ethiopia: Achievements, challenges and Prospects. Ethiopian Institute of Agricultural Research (EIAR). Jima Agricultural Research Center (JARC), Jimma, Ethiopia. 2017; 33: 15-25.
- Castiblanco V, Castillo HE, Miedaner T. Candidate Genes for aggressiveness in a Natural Fusarium culmorum Population Greatly Differ between Wheat and Rye Head Blight. J Fungi. 2018; 4: 14. PubMed: https://www.ncbi.nlm.nih.gov/pmc/articles/PMC5872317/
- Belachew B. Arabica coffee breeding for yield and resistance to coffee berry disease (Colletotrichum kahawae sp. Nov). Dissertation, Imperial College at Wye, University of London. 2001; 232.
- Bedimo JAM, Bieysse D, Njiayouom I, Deumeni JP, Cilas C, et al. Effect of cultural practices on the development of arabica coffee berry disease, caused by Colletotrichum kahawae. Eur J Plant Pathol. 2007; 119: 391.
- Zeru A, Asefa F, Adugna G, Hindorf H. Occurrence of fungal diseases of Coffea arabica. In montane rainforests of Ethiopia. J Applica Botany Food Quality. 2009; 28: 148-151.
- Kagezi H, Patrick K, Judith K, Nicholas OD, Lilian N, et al. Predicting the Response of Insect Pests and Diseases of Arabica Coffee to Climate Change along an Altitudinal Gradient in Mt. Elgon Region, Uganda. J Agric Environmen Sci. 2018; 7: 134-140.
- Kebati RK, Nyangeri J, Omondi CO, Kubochi JM. Effect of artificial shading on severity of coffee berry disease in Kiambu County, Kenya. Ann Res Rev Biol. 2016; 9: 1-11.
- Batista D, Silva DN, Vieira A, Cabral A, Pires AS, et al. Legitimacy and implications of reducing Colletotrichum kahawae to subspecies in plant pathology. Front Plant Sci. 2017; 7: 2051. PubMed: https://pubmed.ncbi.nlm.nih.gov/28119726/
- Bieysse D, Cilas C, Mouen J, Musoli P, Avelino J. Coffee disease risk analysis: how epidemiology knowledge could help in assessing and preventing disease invasion. In: The proceedings of 22nd International Conference on Coffee Science, ASIC 2008; Sep 14-19; Campinas, SP, Brazil. 2009; 1422-1423.
- Cerda R, Allinne C, Gary C, Tixier P, Harvey CA, et al. Effects of shade, altitude and management on multiple ecosystem services in coffee agroecosystems. Eur J Agronomy. 2017; 82: 308-319.
- Vaast P, Bertrand B, Perriot JJ, Guyot B, Genard M. Fruit thinning and shade improve bean characteristics and beverage quality of coffee (Coffea arabica L.) under optimal conditions. J Sci Food Agric. 2006; 86: 197-204.
- Bedimo JM, Njiayouom I, Bieysse D, Nkeng MN, Cilas C, et al. Effect of shade on Arabica coffee berry disease development: toward an agroforestry system to reduce disease impact. Phytopathology. 2008; 98: 1320-1325. PubMed: https://pubmed.ncbi.nlm.nih.gov/19000007/
- Jha S, Bacon CM, Philpott SM, Ernesto Mendez V, Läderach P, et al. Shade coffee: update on a disappearing refuge for biodiversity. Bioscience. 2014; 64: 416-428.
- Biratu T. Studies on Colletotrichum population of Coffea arabica L. in Ethiopia and evaluation of reactions of coffee germplasm. Ph. D thesis, Bonn University, Germany. 1995; 231.
- Zeru A, Teferi D, Jafuka C, Tesfaye S, Siyoum M, et al. Success stories in managing coffee berry disease in Ethiopia. Coffee diversity and knowledge, EIAR, Addis Ababa, Ethiopia. 2008; 239-249.
- Biratu T, Hulluka M. Colletotrichum species associated with coffee berry disease in Hararghe. Ethiopian J Agricu Sci. 1989; 11: 1-6.
- Zakaria M, Bailey JA. Morphology and cultural variation among Colletotrichum isolates obtained from tropical forest nurseries. J Tropi Forest Sci. 2000; 1-20.
- Manuel L, Talhinhas P, Várzea V, Neves Martins J. Characterization of Colletotrichum kahawae isolates causing coffee berry disease in Angola. J Phytopathol. 2010; 158: 310-313.
- Prihastuti H, Cai L, Chen H, McKenzie EHC, Hyde KD. Characterization of Colletotrichum species associated with coffee berries in northern Thailand. Fungal Diversity. 2009; 39: 89-109.
- Abera A, Lemessa F, Adugna G. Morphological Characteristics of Colletotrichum species Associated with Mango (Mangifera indica L.) in Southwest Ethiopia. J Food Sci Quality Manag. 2016; 48: 106-115.
- Silva DN, Talhinhas P, Varzea V, Cai L, Paulo OS, et al. Application of the Apn2 locus to improve the systematics of the Colletotrichum gloesporioides complex: from (Coffea species) hosts. Mycologia. 2012; 104: 396-409. PubMed: https://pubmed.ncbi.nlm.nih.gov/22086913/
- Pires AS, Azinheira HG, Cabral A, Tavares S, Tavares D, et al. Cytogenetic characterization of Colletotrichum kahawae, the causal agent of coffee berry disease, reveals diversity in mini chromosome profiles and genome size expansion. Plant Pathol. 2016; 65: 968-977.
- Chen C, Dickman MB. Proline suppresses apoptosis in the fungal pathogen Colletotrichum trifolin. Proc National Academy Sci. 2005; 102: 3459-3464. PubMed: https://pubmed.ncbi.nlm.nih.gov/15699356/
- Fredrick MN, Owaka M, Chrispine O, Elijah K. Pathogenicity of Colletotrichum kahawae in Kenya. Int J Sci. 2015; 6: 2319-7064.
- Kilambo DL, Silva M, Matagalpa RB, Varzea VMP, Teri JM. Nature of Resistance of Lyamungu Hybrids to Colletotrichum kahawae Strains. Int J Biotechnol Applications. 2013; 5: 137.
- Jeffries P, Dodd JC, Jeger MJ, Plumbley RA. The biology and control of Colletotrichum species on tropical fruit crops. Plant Pathol. 1990; 39: 343-366.
- Kilambo DL, Guerra-Guimaraes L, Varzea V, Loureiro A, Silva M, et al. Pathogenicity of Colletotrichum kahawae strains and their effect on resistant Arabica coffee varieties in Tanzania. 2009; 1430-1438.
- Fokunang CN, Dixon AGO, Akem CN, Ikotun T. Cutural, morphological and pathogenic variability in Colletotrichum gloesporioides f. sp. from cassava (Mani hot esculent) in Nigeria. Pakistan J Bio Sci. 2000; 3: 542-546.
- Beynon SM, Coddington A, Lewis BG, Varzea V. Genetic variation in the coffee berry disease pathogen, Colletotrichum kahawae. Physiol Mole Plant Pathol. 1995; 46: 457-470.
- Chen Z, Nunes M, Silva MC, Rodrigues CJ. Apresorium turgor pressure of Colletotrichum kahawae might have a role in coffee cuticle penetration. Mycology. 2004; 96: 1199-1208.
- Davis AP, Gole TW, Baena S, Moat J. The impact of climate change on indigenous arabica coffee (Coffea arabica): predicting future trends and identifying priorities. PLoS One. 2012; 7: 47981. PubMed: https://www.ncbi.nlm.nih.gov/pmc/articles/PMC3492365/
- Gidisa G. A review on the status of coffee berry disease (Colletotrichum kahawae) in Ethiopia. 2016; 6: 140-151.
- Mtenga DJ, Reuben SOWM. Diversity, combining ability and coffee berry disease (Colletotrichum kahawae) resistance among Ethiopian and Tanzanian Arabica coffee genotypes (Doctoral dissertation) Sokoine University of Agriculture. 2016; 1-76.
- Photita W, Taylor PW, Ford R, Hyde KD, Lumyong S. Morphological and molecular characterization of Colletotrichum species from herbaceous plants in Thailand. Fungal Diversity. 2005; 18: 117-133.Rayner RW. A Mycological Color Chart: In Common Wealth Mycological Institute, Kew, Surrey, UK. 1970; 20.